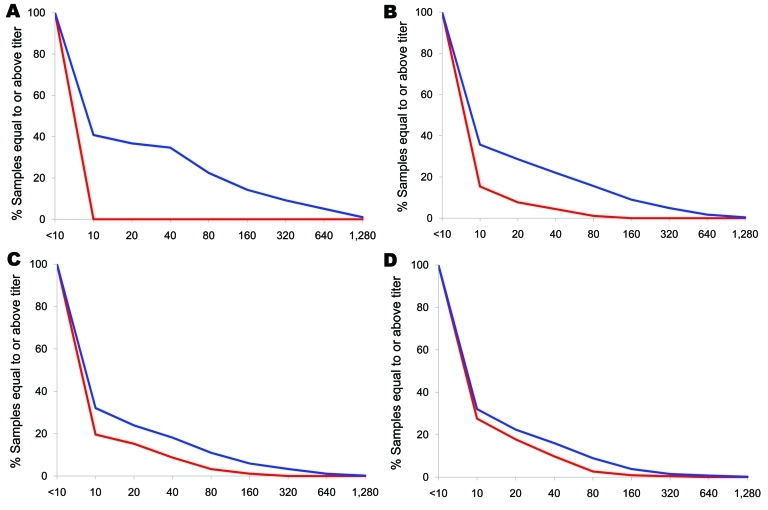
Figure 3.
Reverse cumulative distributions by age group in a study of differential effects of pandemic (H1N1) 2009 on remote and indigenous groups, Northern Territory, Australia, September 2009, showing percentage of population with titer at or above each value. A) <15 years of age; B) 15–34 years of age; C) 35–54 years of age; D) >55 years of age. Red, prepandemic titer; blue, postpandemic titer.

