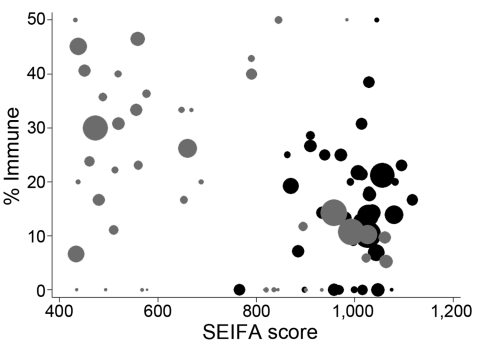
Figure 5.
Postpandemic proportion of Statistical Local Area (SLA) demonstrating titers >40 by Socio-economic Index for Area (SEIFA) of relative socioeconomic disadvantage. Gray circles, Urban Darwin; black circles, Rural Top End and Central Australia. Circle size proportional to number of specimens in group. Lower score indicates greater degree of relative socioeconomic disadvantage. One SLA containing 1 observation with a proportion immune of 100% is not displayed.

