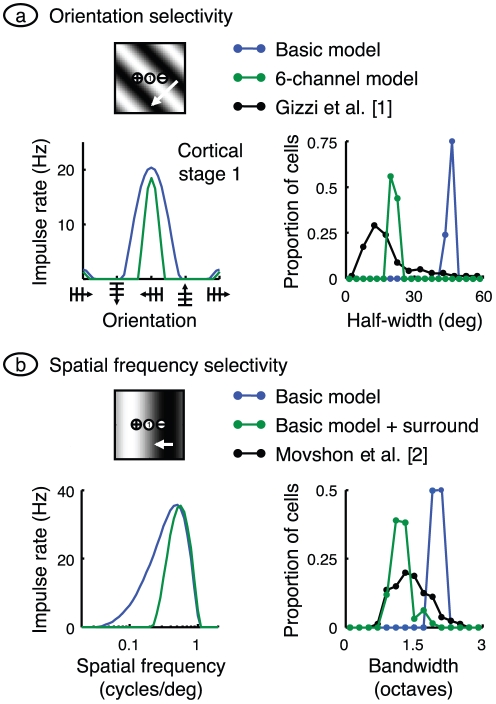
Figure 3. Spatial selectivity.
a. Orientation selectivity in the model was tested by drifting a grating across the visual field with a variety of orientations. The methods were chosen to mimic those used by Gizzi et al. [1]: spatial frequency was optimal, 0.49 cycles/deg. Mean impulse rate for the cell centrally located in cortical stage 1 is shown at left in blue. The precision of orientation selectivity was found by measuring the half-width of this tuning curve at half-height. Half-width of all active stage 1 cells is shown by the blue frequency histogram at right, and compared with the data of Gizzi et al., shown in black. Clearly, the basic model has much poorer selectivity than that measured in the laboratory. This mismatch is partially remedied by using the six-channel model, as shown by the green curves. b. The basic model's spatial frequency selectivity was tested using the same methods as Movshon et al. [2], and is shown in blue. The tuning curve at left was computed by drifting a grating with optimal orientation, and a range of spatial frequencies. The response in the centrally located cell in cortical stage 1 was measured as the elevation of mean rate resulting from the stimulus. The half-width at half-height of all active stage 1 cells is shown as a frequency histogram at right, and compared with the data of Movshon et al., given by the black curve. The mismatch between the two histograms was largely removed by adding a surround mechanism to the sub-cortical channels, as shown by the green curves.

