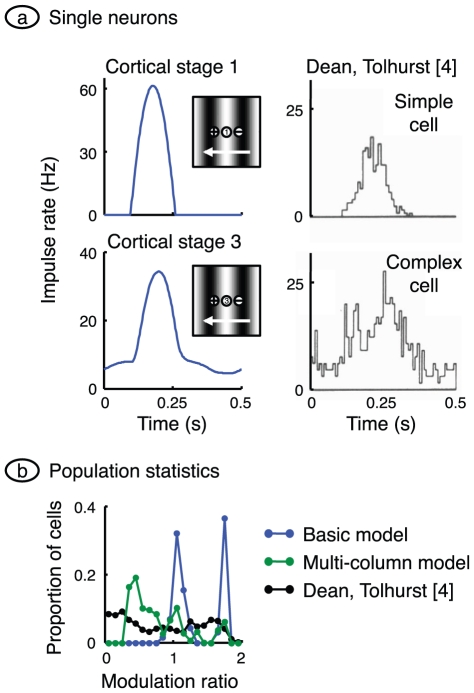
Figure 6. Complex-like responses.
a. A grating of optimal orientation and spatial frequency, and a contrast of 0.25, was drifted across the receptive field patch. Impulse rate was computed for the centrally located neuron in cortical stages 1 and 3. Response measures were chosen to match those of Dean and Tolhurst [4] whose measurements from a simple cell and complex cell are shown at right (reprinted by permission from John Wiley and Sons Ltd.). The reduced impulse rate modulation in the stage 3 cell is due to rectification in previous stages, and static depolarisation. b. For each cell in their sample, Dean and Tolhurst calculated a modulation ratio equal to the Fourier fundamental amplitude of impulse rate divided by the mean rate. Their frequency histogram is shown in black. We have calculated the same ratio across all active cells in all three cortical stages of the basic model, and the resulting histogram is shown in blue. Stage 1 contributes the peak on the right and stages 2 and 3 together give the central peak. As in the laboratory, complex-like cells have a modulation rate close to or less than 1. A closer match between model and laboratory was obtained by allowing rectified geniculate impulse rates, as shown by the green histogram.

