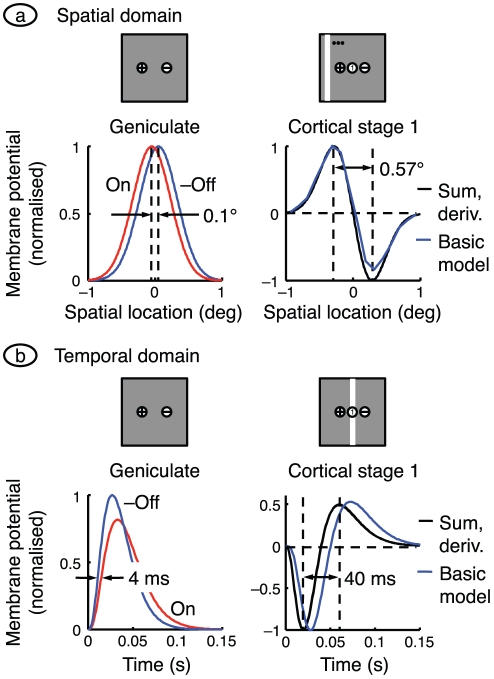
Figure 7. Approximating cortical responses with derivatives.
a. The receptive field spatial profiles for the two sub-cortical channels in the basic model are shown on the left. The distance between peaks is set equal to the distance between neighbouring on- and off-centre X-type ganglion cells, and the off-centre signal is inverted. The graph on the right shows the sum of the two sub-cortical profiles and the spatial derivative of one of them (shifted so that the zero-crossing is centred). The sum and derivative are indistinguishable. The response of the centrally located neuron in cortical stage 1 of the basic model is also shown. It was calculated with the same bar stimulus used in Figure 5a , and the response is the generator potential 70 ms after bar onset. There is a good match between all three curves. b. The time courses on the left are impulse responses for the on- and off-centre geniculate cells in the basic model, with the off-centre curve inverted for ease of comparison. The sum of the on- and off-centre responses is shown in black on the right, along with the derivative of one of the responses (computed with the mean of the on- and off-centre time constants); the sum and derivative are indistinguishable. Also shown, in blue, is the time course of the membrane potential in the first-stage cortical cell at the middle of the receptive field patch. Its impulse response was calculated by delivering a very brief bar of light (width = 0.25°) at the middle of the patch. The black lines give the synaptic drive to the cortical cell and the blue line is relatively delayed because the cortical cell acts as a low-pass filter.

