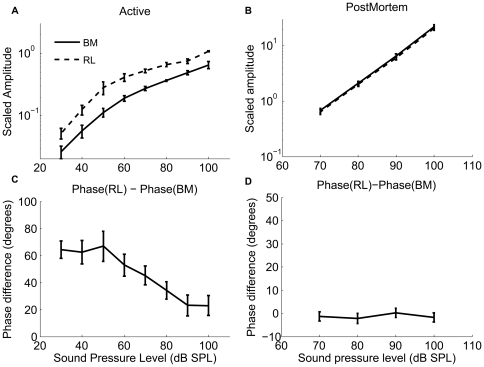
Figure 3. Displacement magnitude difference (a, b) and the phase difference(c, d) as a function of the sound level between the basilar membrane (BM) and reticular lamina (RL).
The mean ± standard error of the BM vibration magnitude (solid lines) and the RL displacement (dashed lines) and the displacement difference between the RL and the BM as a function of sound level from live animals (a) and postmortem animals (b); The phase difference between the RL and the BM magnitude and the phase as a function of the sound level from live animals (c) and postmortem animals (d). In order to group the animals, the frequencies were normalized with respect to the best frequency, which varied among the animals at the chosen measurement locations. This compensates for the slight variations in the best frequencies in the different experiments (best frequency range, 18.75–22.25 kHz). BFP is around 15 kHz at postmortem in the experiments.

