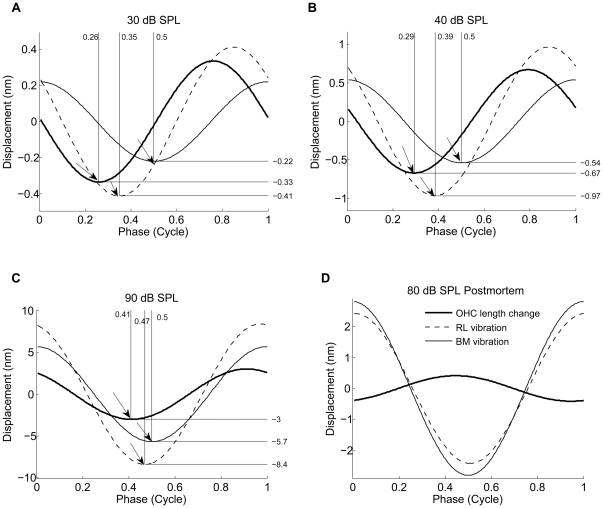
Figure 6. The timing of the BM and the RL displacement and the OHC contractile length change.
The timing of the OHCs contraction and the RL and the BM displacement at the sound level of 30 dB (a), 40 dB (b) and 90 dB (c) from a sensitive animal (hearing loss<10 dB) and at the sound level of 80 dB from the postmortem animals. Positive direction is the direction to the SV for the RL and the BM displacements, and expansive for the OHC length-change. The arrow pointed at the OHC length change curve indicates the shortest position of the OHC, the arrow pointed at the RL vibration curve indicates the time (phase) when the RL has moved farthest into the ST, the arrow pointed at the BM vibration curve indicates the time (phase) when the BM has moved farthest into the ST. Note the phase difference between the OHC contractile length change and the RL and the BM displacement.

