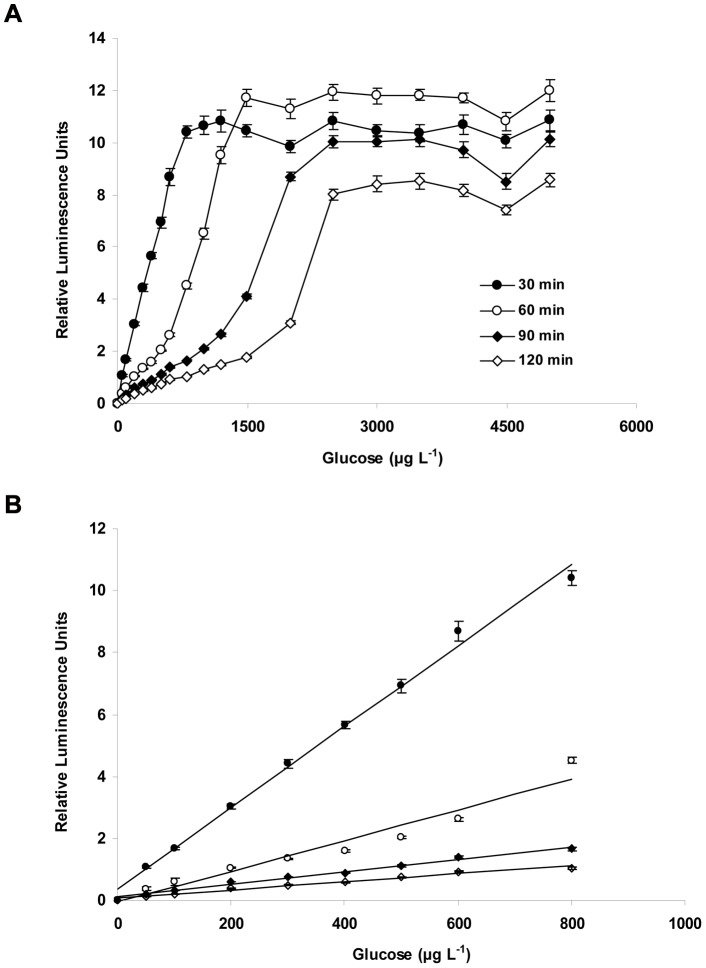
Figure 3. Relative luminescence strength of V. harveyi in response to different glucose concentration and incubation time (3A), and linear range (3B).
Cell suspension (optical density at 600 nm about 1.5) added was 20 µl, incubation time varied from 30 min to 120 min. The data represent the average of triplicate soil measurements.

