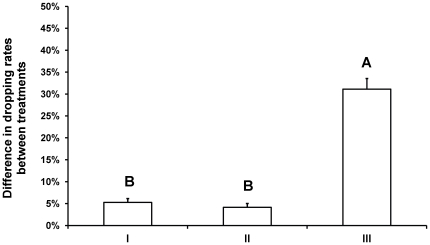
Figure 4. Increase in the dropping rates of pea aphid nymphs when exposed to a second vibration and its two controls.
Data are the average percentage of the nymphs in the colony that dropped (±1 SE). Percentage data were arcsine square-root transformed prior to analysis. X-axis labels denote: I: The difference between the response to a 2 s and a 4 s artificial breath. II: The difference between the response to one vibration and two consecutive vibrations. III: The difference between the response to one vibration during a 2 s artificial breath and two vibrations during a 4 s artificial breath. Each bar represents an average of the differences within 20 randomly assigned pairs of data from the two compared treatments.

