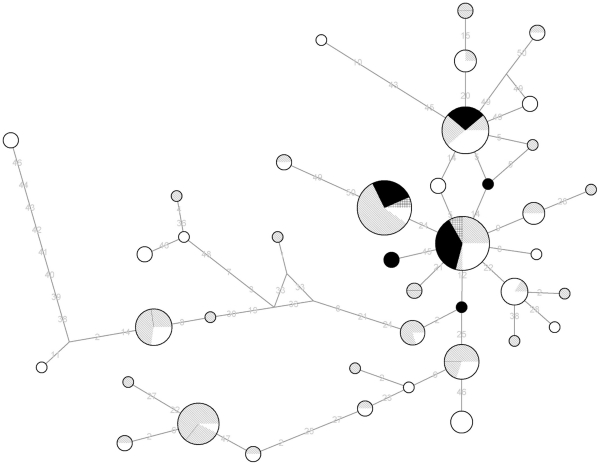
Figure 1. Median-joining network for the different haplotypes.
Circles are proportional to the frequency of each haplotype. The colour of each sector refers to the host species: Nigerian samples (squared sectors), other African haplotypes (black), Europe and Asia (grey lines), North and South America (white). The lengths of the segments are proportional to the number of mutations involved between two haplotypes.

