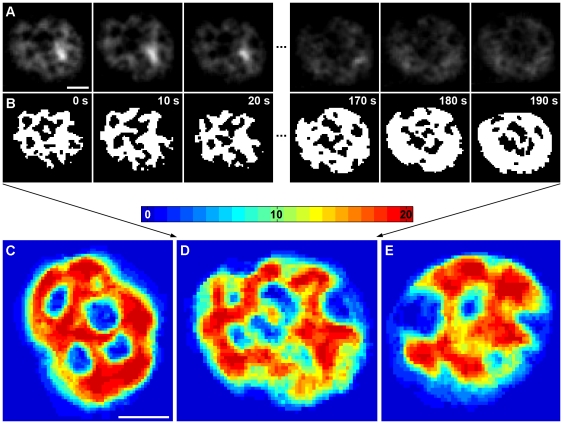
Figure 3. Differential cortical ER coverage defines micron-scale PM domains.
The dynamics of cortical ER was followed in time-lapse series of 20 tangential confocal sections of BY4741 cells expressing ss-GFP-HDEL together with Sur7-mCherry (rate: 10 s/frame). Raw data after a 3×3 mean filtration (A) and binarized cortical ER pattern (B) of the first and the last three frames in the series are presented. For better lucidity, the red fluorescence channel (MCC/Sur7-mCherry) is not shown. In order to visualize the local dynamics of cortical ER, all twenty binarized frames were superimposed. Three out of 33 cells analyzed are presented in false colors denoting the number of frames in the series in which cortical ER was detected (C–E). Bar: 1 µm.

