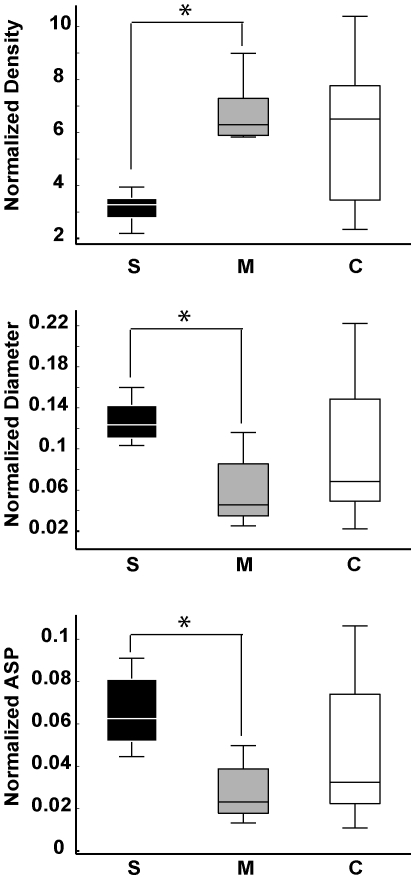
Figure 7. Normalized global speech graph measures were significantly different between schizophrenics (S) and manics (M).
Boxplots of normalized data show significant differences between schizophrenics and manics for Density (P = 0.007), Diameter (P = 0.0138) and ASP (P = 0.0104) with small variance for both groups. In contrast, control subjects yielded a wide span of values between manics and schizophrenics, with high variance.

