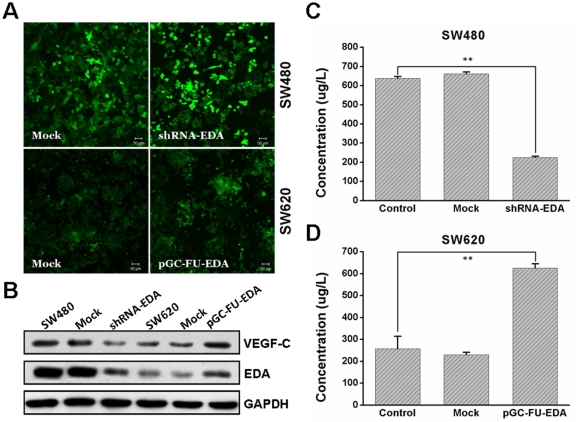
Figure 2. Expression of cellular and secreted VEGF-C protein in transfected cells and control cells.
(A) shRNA-EDA SW480, mock SW480, pGC-FU-EDA SW620 and mock SW620 were confirmed by fluorescent microscopy. (B) Expression of EDA and VEGF-C protein was determined by western blotting. GAPDH was a loading control. VEGF-C protein concentration in transfected SW480 group(C) and transfected SW620 group (D) was detected by ELISA. This experiment was repeated in duplicate more than three times. The error bars are the means ± SEM. and ** p < 0.01 is considered as statistically significant. Scale bar = 50 µm.

