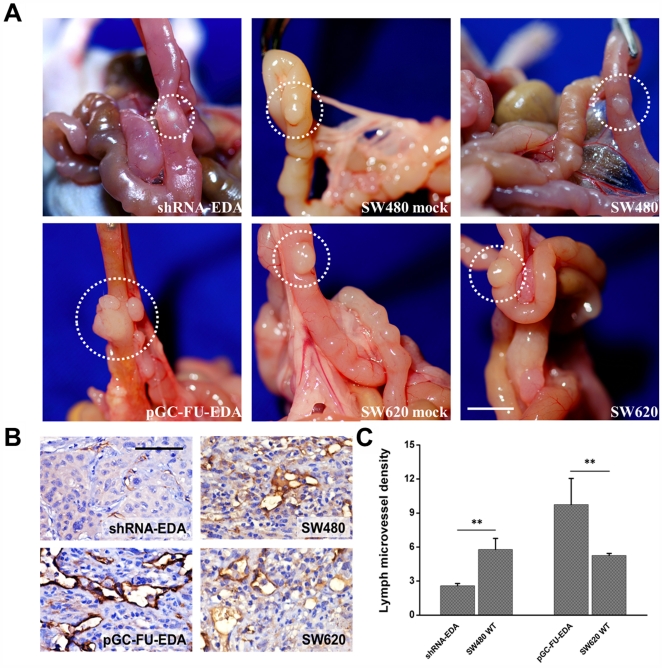
Figure 5. Orthotopic xenografts derived from transfected cells and control cells.
Seven to 8 wk old male BALB/c nude mice were orthotopically implanted with 6 groups of tumor xenografts. (A) Representative images of xenografts. Orthotopic images of xenograft tumors derived from 6 groups of transfected cells and control cells. Scale bar = 5 mm. (B) Expression of LYVE-1 was used to count LMVD in xenografts by immunohistochemical staining. The distribution of lymph vessels was stained brown under the light microscope. Scale bar = 50 µm. (C) Quantification of lymph microvessel density (LMVD) is shown. The results shown are the average of three experiments. ** p < 0.01, as compared with control group. The values are displayed as the mean ± SEM.

