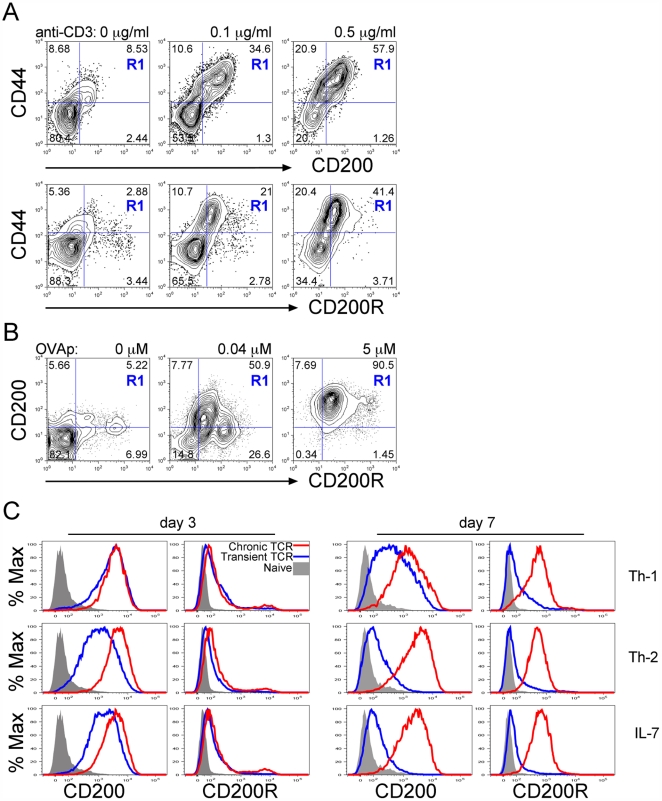
Figure 1. T cells co-express CD200 and CD200R following TCR activation.
A. Naïve C57BL/6 peripheral LN cells were cultured with a titration of anti-CD3 + anti-CD28 (2 µg/ml) for 3d. Contour plots show upregulation of CD200 (upper row) and CD200R (lower row) together with CD44 (R1) in gated CD4 cells. B. DO11.10 LN and spleen cells were cultured with a titration of OVA peptide (ISQAVHAAHAEINEAGR) for 3d. CD200R:CD200 co-expression (R1) is shown in gated CD4 cells. C. Naïve LN cells were stimulated with anti-CD3 (1 µg/ml) + anti-CD28 (2 µg/ml) either transiently on Ab-coated wells for the first 2d then removed to fresh media (blue lines) or chronically with Ab-coated aAPC present throughout the culture (red lines) in Th1 (top row), Th2 (middle row) or non-polarising (IL-7, bottom row) conditions. Histograms show expression of CD200 and CD200R in gated CD4 cells at d3 (left) and d7 (right) compared to naïve levels (grey filled histograms). Data are representative of 6 independent experiments and statistical validation is shown in Figure S1A and S3C.

