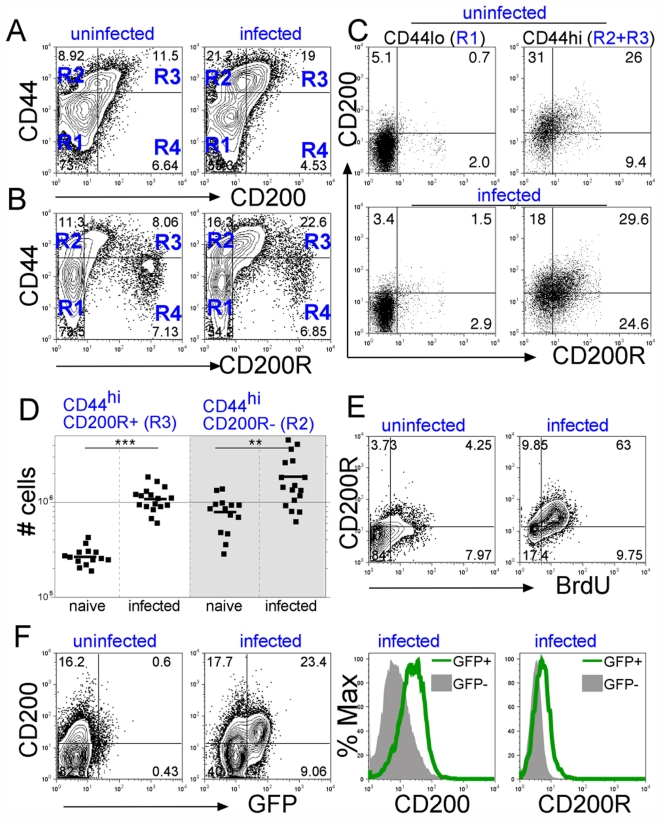
Figure 3. Chronic infection induces CD200 and CD200R expression in CD4 T cells.
C57BL/6 (A–E) and 4-get (F) mice were infected with S. mansoni; MesLN (A–D, F) and spleen (E) were analyzed. A. Representative contour plot of CD44 with CD200, and B. CD44 with CD200R is shown for gated CD4 T cells. Upon infection (8 wk), CD44hiCD200+CD4 cells (panel A, R3) increased from 7.71±2.66% (n = 14) to 15.2±3.72% (n = 17, p<0.0001); CD44hiCD200R+CD4 cells (panel B, R3) increased from 4.36±1.69% (n = 14) to 15.3±4.67% (n = 17, p<0.0001). Data were pooled from 4 independent experiments. C. Dot plots show CD200 and CD200R co-expression in CD44lo and CD44hi CD4 cells from uninfected and infected mice. D. Graph shows absolute numbers of CD200R+ (panel B, R3) and CD200R– (panel B, R2) CD44hiCD4 cells from 4 independent experiments. Upon infection CD44hiCD200R+ cells increased from (2.7±0.6)× 105 (n = 14) to (10.8±3.2)×105 (n = 17, ***p = 3.03×10⁻¹⁰), while CD44hi CD200R– cells increased from (7.9±3.3)×105 to (18.6±11.9)×105 (**p = 0.003). E. Contour plots show CD200R expression in proliferating (BrdU+) cells, in gated CD4 cells for spleen of uninfected and infected mice. Upon infection BrdU+CD200R+ CD4 T cells increased from 4.5±0.69 (n = 4) to 46.6±17 (n = 10) p<0.0005. Specificity controls for BrdU staining are shown in Figure S7A & B. F. Contour plots (left) show CD200 and eGFP expression; CD200+GFP+CD4 cells increased from 0.64±0.12% to 13.7±7.24% after infection (p = 0.01, n = 4). Histogram overlays (right) show CD200 and CD200R levels in gated GFP+ (green line) and GFP– (filled histograms) CD4 cells from infected mice. Control stainings for intracellular GFP staining are shown in Fig S5B & C. ** = p<0.0001, * = p<0.001. Results are representative of at least 4 (A–D) and 3 (E-F) independent experiments (n = 3 mice/group).

