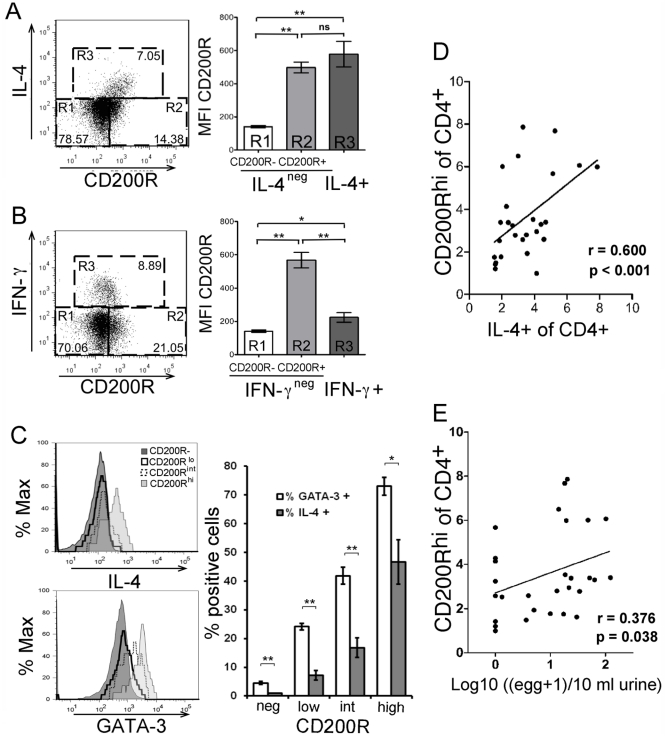
Figure 5. CD200R correlates with infection intensity in human schistosomiasis.
Expression of CD200R and IL-4 (A) or IFNγ (B) in gated CD4 T cells from blood after recall with PMA + Ionomycin. Isotype control stainings are shown in Figure S9. Charts show mean (±s.e.) of CD200R MFI in R1-3. C. CD200R-, CD200Rlo and CD200Rhi αβTCR+CD4 cells were analysed for IL-4 and GATA-3 expression. One representative sample is shown in left histograms. Mean percentage (±s.e.) of cells in each population are shown in the bar graph. * = p<0.05, ** = p<0.01 (n = 8, ANOVA A–C). D. Correlation between the percentages of IL-4+ and CD200R+ CD4 T cells, respectively determined by intracellular and surface stain. E. Correlation between the proportions of CD200RhiCD4 T cells and infection intensity determined as urine egg counts (n = 29, D-E). Percentages of CD200RhiCD4 T cells and IL-4+CD4 T cells were arcsine square root transformed to allow the use of parametric tests. Infection intensity was Log10(x+1) transformed. To allow for potential confounding effects of sex (categorical variable) and age (continuous variable) transformed data were assessed by ANOVA. Resulting residuals were used to analyse the correlation between both CD200RhiCD4 T cells and IL-4+CD4 T cells or between CD200RhiCD4 T cells and infection intensity of which the r-correlation coefficients and p-values are indicated.

