
Figure 2.
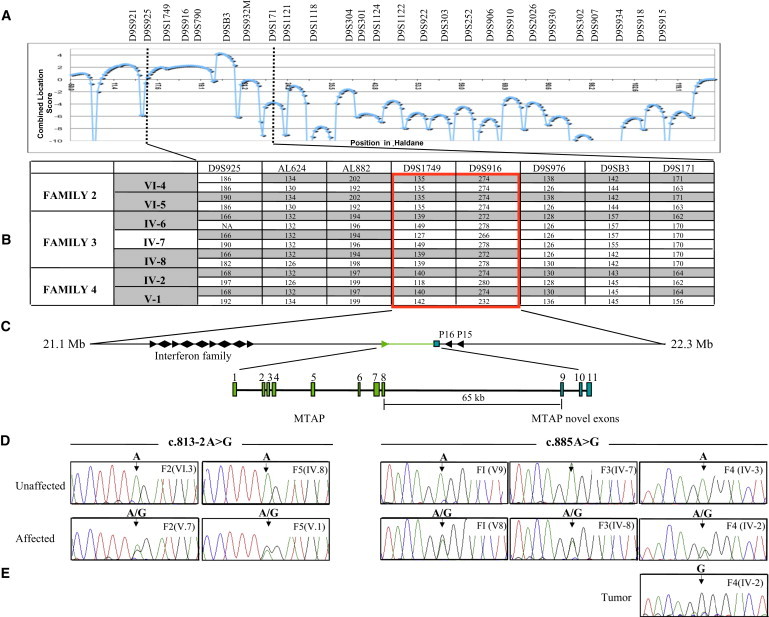
Identification of the Critical Region and the DMS-MFH-Associated Gene
(A) The results of a combined multipoint parametric linkage analysis for families 2, 3, and 4. The maximal location score is 4.27 at marker D9SB3.
(B) Haplotype analysis of informative individuals from families 2, 3, and 4 narrowed the DMS-MFH critical region (boxed).
(C) Physical map of the DMS-MFH critical region, which spans 1.3 Mb between the flanking markers AL882 and D9S976. Arrows indicate transcriptional direction of candidate genes. The exon-intron structure of MTAP highlights the eight exons of MTAP (green) and the three terminal exons (blue). Maps are not drawn to scale.
(D) Representative DNA-sequence chromatograms from selected affected and unaffected individuals from each family.
(E) Tumor DNA sequence revealing homozygosity of the diseased allele and loss of the unaffected allele.