
Figure 5.
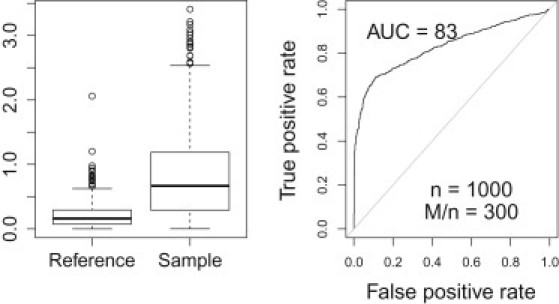
Performance with Covariate Adjustment
This figure shows the ROC curve for with rank normalized cholesterol levels as phenotype and sex, age, and allelic dosage as covariates. Note that the performance is not changed by adding the additional covariates.