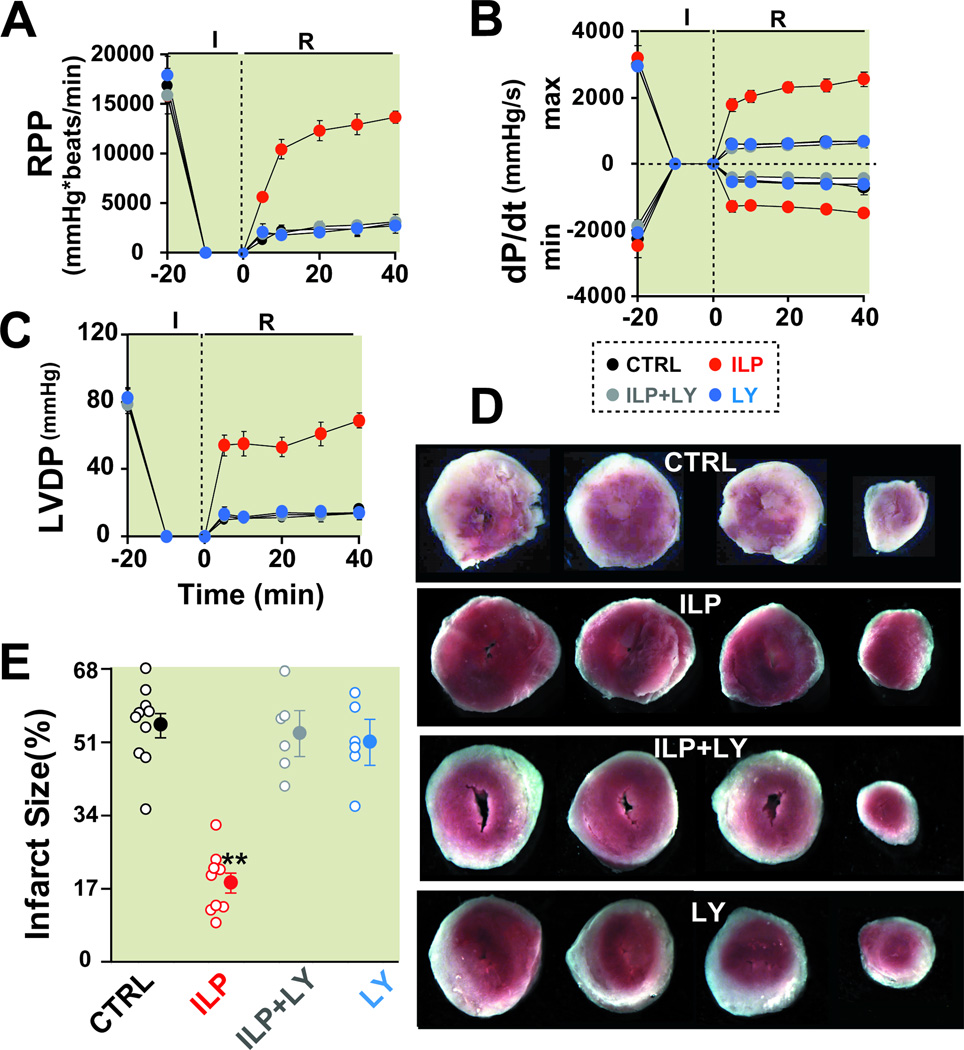
Figure 3. PI3K inhibitor abolishes Intralipid-induced cardioprotection against ischemia/ reperfusion injury.
Rate pressure product (RPP, A), the maximum rate of left ventricle (LV) pressure rise (dP/dtmax) and decline (−dP/dtmin, B) and left ventricular developed pressure (LVDP, C) as a function of time in control group (CTRL, black, n=6), 1% Intralipid (ILP, red, n=6), 1% Intralipid+LY294002 (ILP+LY, gray, n=6) and LY294002 alone (LY, blue, n=6). D. Four slices of the same heart in CTRL, ILP, ILP+LY and LY alone after 2,3,5-triphenyltetrazolium chloride (TTC) staining. The white area represents the infarct zone and the red shows the viable area. E. The area of necrosis as the percentage of total left ventricular (LV) area in CTRL (black, n=10), ILP (red, n=9), ILP+LY (gray, n=6) and in LY (blue, n=6). The individual measurements in each group are shown in open circles whereas the averages (Mean±SEM) are shown in filled circles **P<0.01 vs. CTRL.

