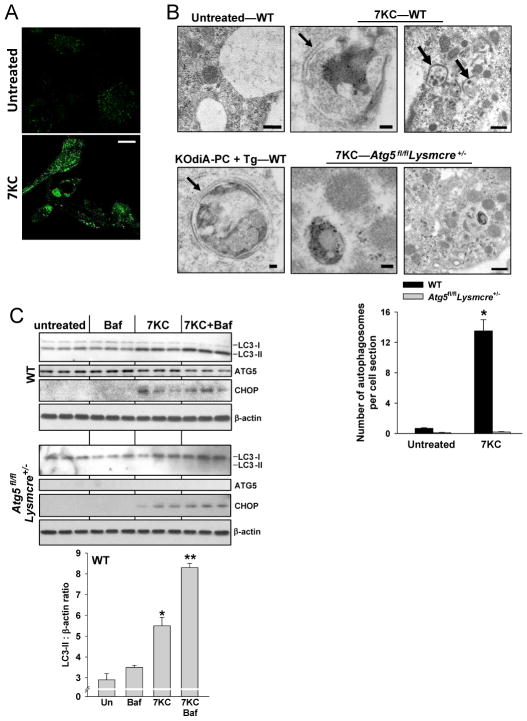
Figure 1. Autophagy is Induced in Macrophages Exposed to Atherosclerosis-Related Stimulators of Apoptosis.
(A) Confocal fluorescence microscopy of macrophages from GFP-LC3 transgenic mice that were left untreated or treated for 8 h with 35 μM 7-ketocholesterol (7KC). Bar = 10 μm.
(B) Electron microscopy of macrophages from WT or Atg5fl/flLysmCre+/− mice that were left untreated or treated for 6 h with 7KC or 50 μg/ml of KOdiA-PC plus 0.5 μM thapsigargin (KOdiA-PC + Tg). Double-membranes are depicted by arrows. Bar, 100 nm for left and middle row of images and 500 nm for right row of images. Quantification of the average number of autophagosomes per cell section in untreated and 7KC-treated WT and Atg5fl/flLysmCre+/− macrophages is shown (mean ± S.E.M.; *p < 0.01 vs. other groups; n = 10 cell sections/group).
(C) Macrophages from WT or Atg5fl/flLysmCre+/− mice were left untreated or incubated for 4 h with 7KC. In some groups, 10 μM bafilomycin A1 (Baf) was added during the last 2 h. Cell extracts were probed for LC3-I, LC3-II, Atg5, CHOP, and β-actin by immunoblot. Densitometric quantification of the WT immunoblot data are shown in the graph (mean ± S.E.M.; *,**p < 0.05 vs. the other groups and each other).

