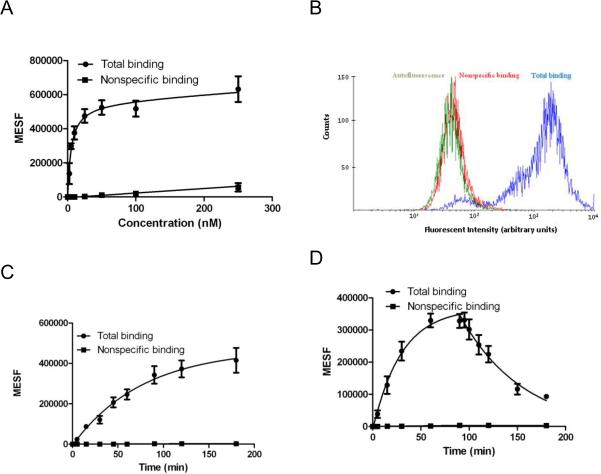
Figure 5.
Fluorescence binding experiments with MRS5449 using FCM in CHO cells expressing hA3AR. MFI of the cell-small molecule conjugates were measured with FACSCalibur flow cytometer. MFI values were converted into MESF values using QuickCal program v. 2.3 after correcting for autofluorescence. A) Saturation binding of MRS5449. Nonspecific binding was measured in the presence of 10 μM selective hA3AR antagonist MRS1220. The Kd value was determined to be 5.15±1.11 nM. Results are expressed as mean ± S.E. (n=3). B) Histogram of the total binding (blue), nonspecific binding (red) and autofluorescence (green) of 10 nM MRS5449 to CHO cells expressing hA3AR after 90 min incubation. The histogram represents data of one of the three independent experiments. C) Association binding kinetics of MRS5449 to CHO cells expressing hA3AR. CHO cells expressing hA3ARs were incubated with 10 nM MRS5449 for different time intervals. Nonspecific binding was measured in the presence of 10 μM MRS1220. The t1/2 for association was found to be 53 min. Results are expressed as mean ± S.E. (n=3). D) Dissociation kinetics of MRS5449. The concentration of MRS5449 used in association and the dissociation experiments was 10 nM. Dissociation was initiated after 90 min by adding 10 μM MRS1220. Kd was found to be 6.65 ± 0.55 nM. Results are expressed as mean ± S.E. (n=3).

