Figure 6.
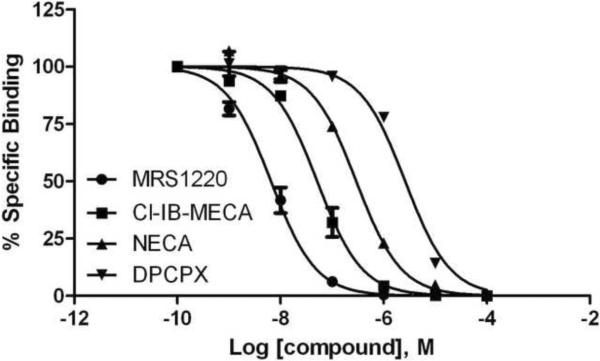
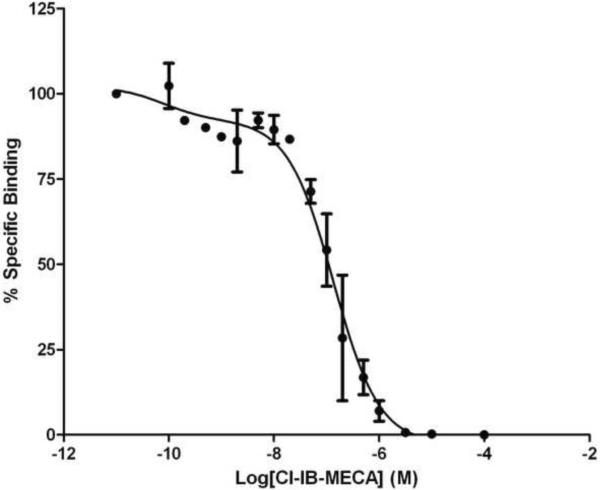
A) Test of known AR ligands (MRS1220, Cl-IB-MECA, NECA and DPCPX). Competitive binding assay was performed using CHO cells expressing the hA3AR incubated with 5 nM MRS5449 and increasing concentrations of the adenosine receptor ligands for 90 min at 37 °C. The Ki values are (nM): 3.46 ± 0.8; 27.7 ± 6.3; 149 ± 13 and 1320 ± 60; respectively. Results are expressed as mean ± S.E. (n=3). B) Detailed displacement curve of Cl-IB-MECA using MRS5449 as a tracer. Competitive binding assay was performed using CHO cells expressing hA3AR incubated with 5 nM MRS5449 and increasing concentrations of the Cl-IB-MECA for 90 min at 37 °C. The displacement curve can be best fitted in a two-site model. Results are expressed as mean ± S.E. (n=2).


