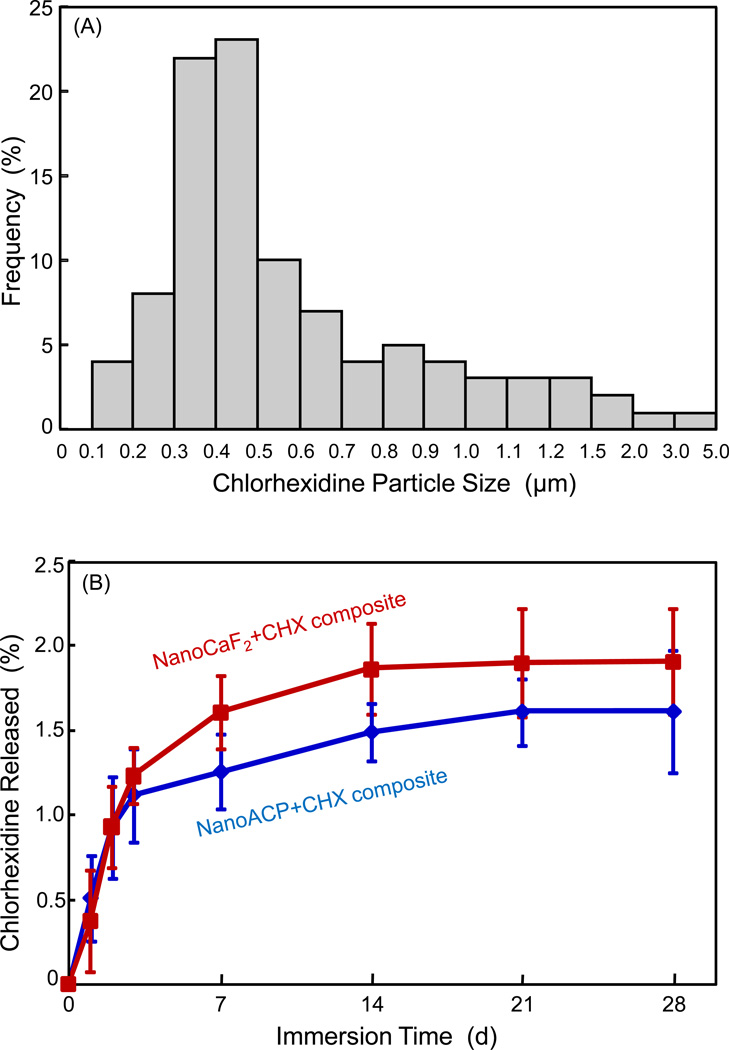
Figure 1.
(A) CHX particle size distribution, based on the measurement via SEM of 100 random particles. (B) CHX release from ACP and CaF2 nanocomposites. Each value is the mean of three measurements with the error bar showing one standard deviation (mean ± sd; n = 3), with specimens immersed in a physiological solution at pH 7 from 1 d to 28 d.

