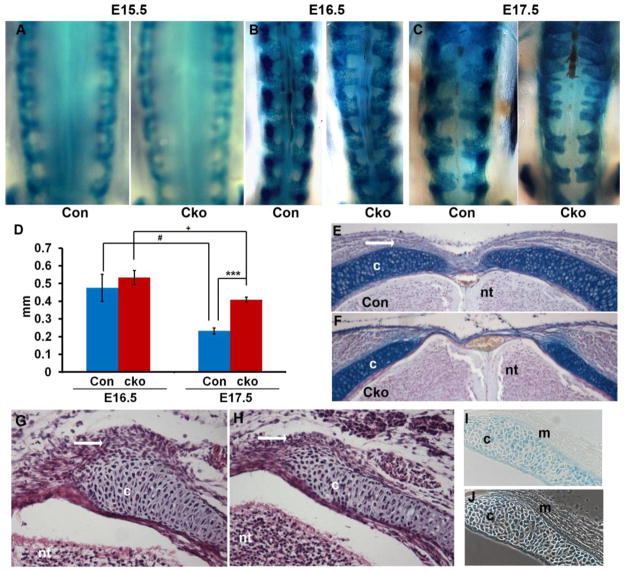
Figure 1. Disrupted formation of the dorsal vertebrae in Tgfbr2cko embryos.
(A–C) Representative images of whole mount X-gal staining on control (Con) and Tgfbr2cko (Cko) embryos at E15.5, E16.5 and E17.5 days. Magnification: 25×. (D) Measurements of the gap between neural arches at the second lumbar region from E16.5 and E17.5 embryos. Data was analyzed by 2-way ANOVA; N=5; ***, P<0.001 [E17.5 Cko vs E17.5 Con]; #, P<0.05 [E17.5 Con vs E16.5 Con]; +, P<0.05 [E17.5 Cko vs E16.5 Cko]. (E, F) Alcian blue staining of sections from lumbar vertebrae of E17.5 control and Tgfbr2cko embryos. Dense mesenchyme dorsal to the neural arch is seen in the control (white arrow). Magnification: 10×. (G, H) H & E staining of cryosections of the lumbar region from E15.5 control and Tgfbr2cko embryos. Dense mesenchyme adjacent to the sclerotome-derived cartilage is visible surrounding the dorsal edge of the neural arch in control mice (G, white arrow). This mesenchyme is reduced or absent in mutants (H, white arrow). Magnification: 20×. (I) Cryosection of X-gal stained E15.5 Col2aCre+;Rosa26/+ embryo. Cre activity is seen as blue X-gal stain in sclerotome derived cells. Staining is not observed in the adjacent sclerotome-associated mesenchyme. (J) Phase contrast image of I to show unstained adjacent mesenchyme. Magnification: 20×. c: cartilage; nt: neural tube; m: sclerotome associated mesenchyme.

