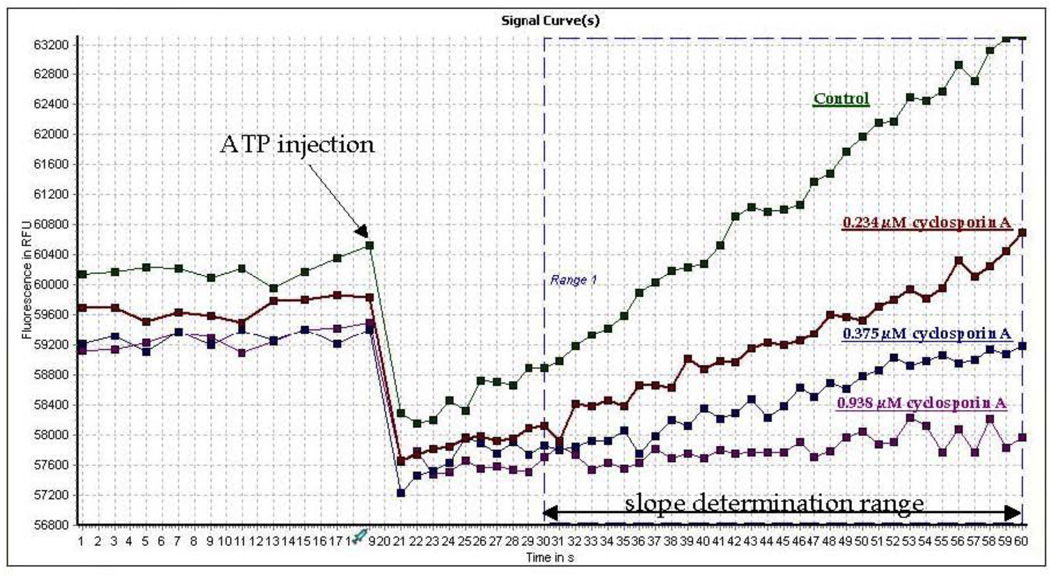
Fig. 2.
Screen shot of Pgp activity assay using Fl-t-pgp reagent in the presence of three concentrations of cyclosporin A. Samples (100 µL each) in a BMG NOVOStar injecting fluorescence plate reader were scanned in well mode for 20 s to establish a baseline. At 20 s, 5 µL of ATP stock solution was rapidly injected into each well (final concentration 2 mM), and fluorescence increase was monitored over 30 s, beginning 10 s post-injection. (The sharp drop in fluorescence observed upon ATP injection is an instrumental artifact.) Onboard software calculated the slope of fluorescence at each concentration of cyclosporin A, and % of Pgp inhibition at each concentration of cyclosporin A is the ratio of that slope to the control slope.

