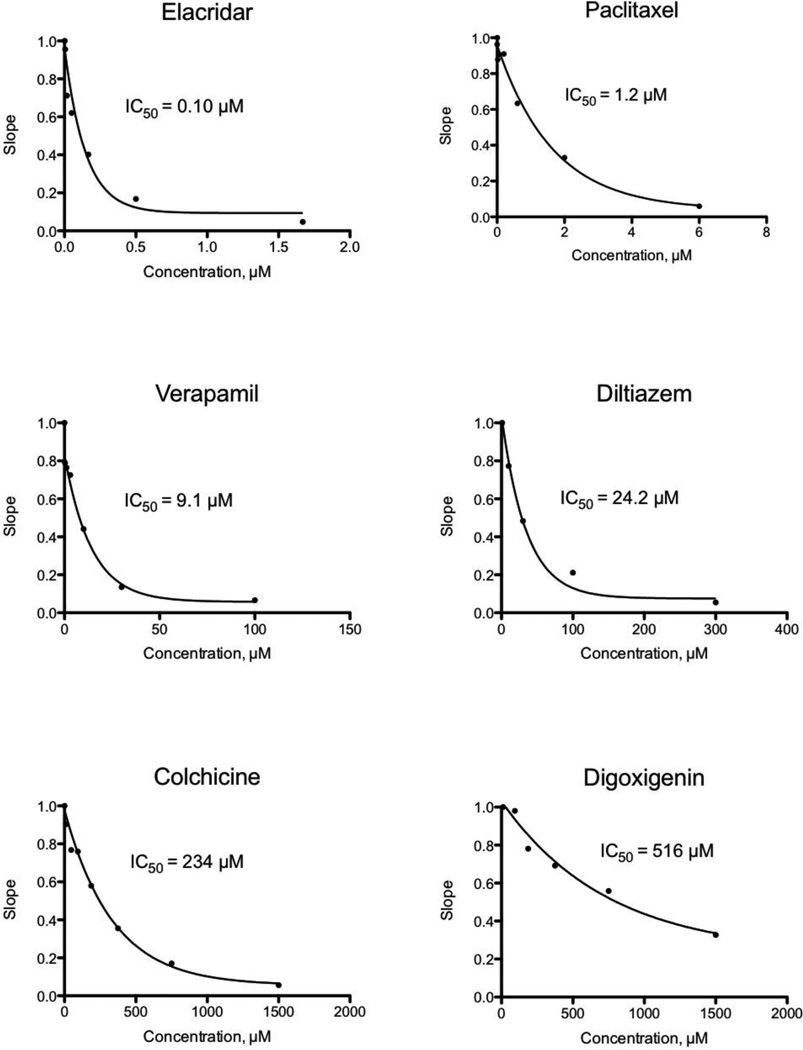
Fig. 3.
Representative IC50 plots derived from Fl-t-pgp assays. Individual points represent the activity of Pgp in the presence and absence of test compound, normalized to a value of 1 for controls. IC50 values were calculated by fitting the relative activity at each test compound concentration to a monophasic decay. The IC50 value is the test compound concentration causing 50% inhibition of Pgp transport activity.

