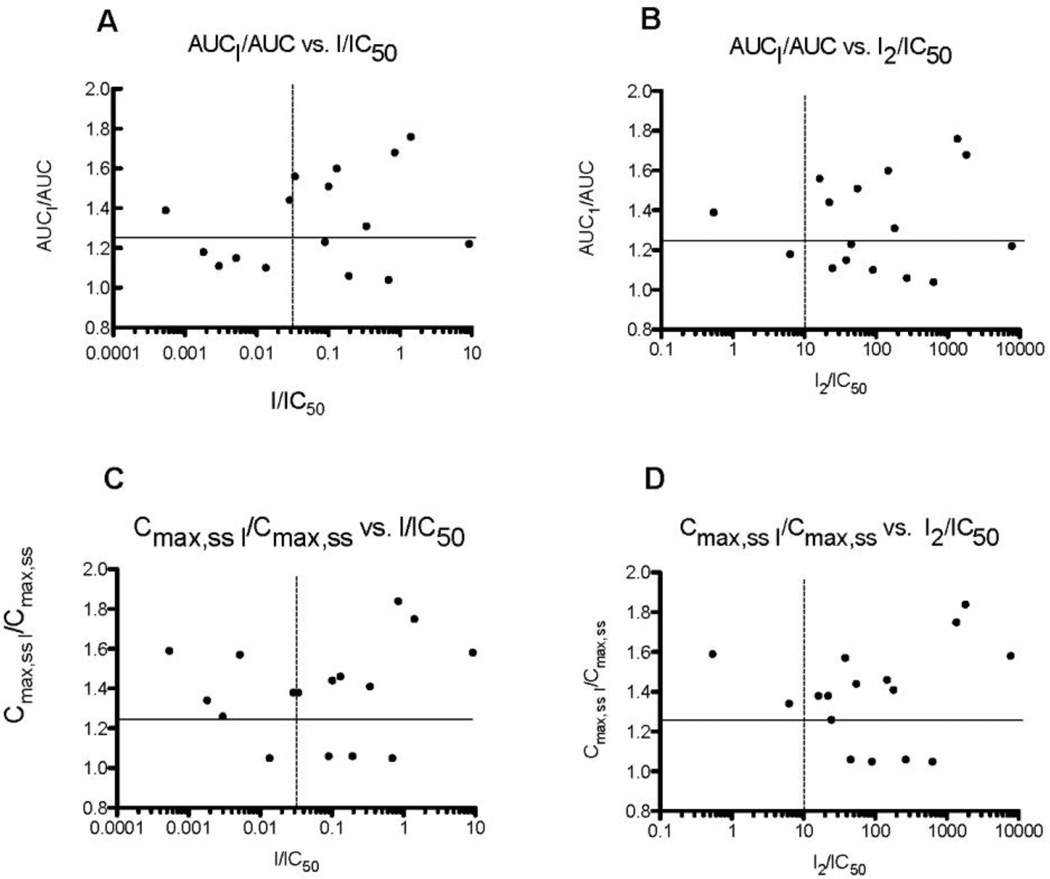
Fig. 7.
(a) Plot of the ratio of AUC for digoxin in the presence and absence of drug (inhibitor) vs. the ratio of peak plasma concentration of drug (inhibitor) and the IC50 for Fl-t-pgp. (b) Plot of the ratio of AUC for digoxin in the presence and absence of drug (inhibitor) vs. the ratio of gastrointestinal concentration of drug (inhibitor) and the IC50 for Fl-t-pgp. (c) Plot of the ratio of Cmax for digoxin in the presence and absence of drug (inhibitor) vs. the ratio of peak plasma concentration of drug (inhibitor) and the IC50 for Fl-t-pgp. (d) Plot of the ratio of Cmax for digoxin in the presence and absence of drug (inhibitor) vs. the ratio of gastrointestinal concentration of drug (inhibitor) and the IC50 for Fl-t-pgp. In vivo data are taken from Fenner et al. (Fenner et al., 2009).

