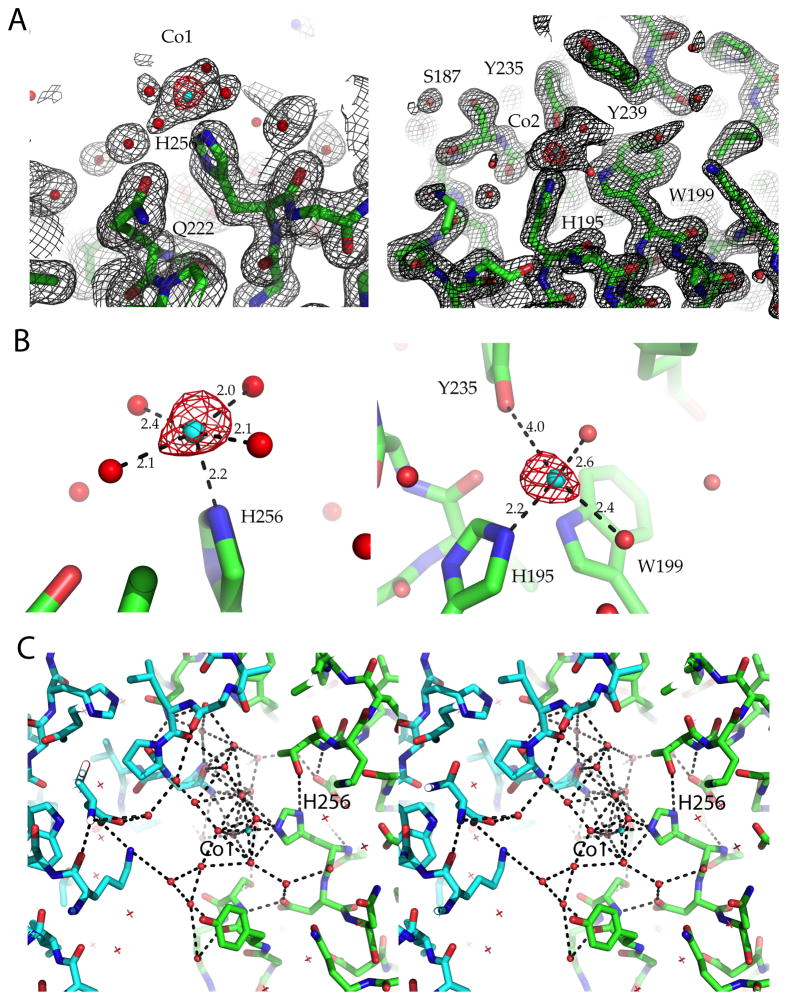
Figure 5. Electron density maps of PfGAP50.
2Fo-Fc electron density map contoured at 1.5σ and the corresponding anomalous difference map in red contoured at 6σ Cobalt ions are shown as cyan spheres and waters as red spheres.
A) Cobalt site 1 (left panel), located near the active site of hPAP after super positioning Cobalt site 2 (right panel). See also Figure 4A for an overview.
B) Distance to binding partners of Cobalt site 1 (left panel) and Cobalt site 2 (right panel), which is approximately 18 Å apart from Cobalt site 1.
C) Stereo figure of the hydrogen bonding network observed in the crystal lattice near the conserved His256 interacting with Cobalt site 1, which in its turn interacts with a crystallographically related GAP50 (cyan backbone) via its water ligands.

