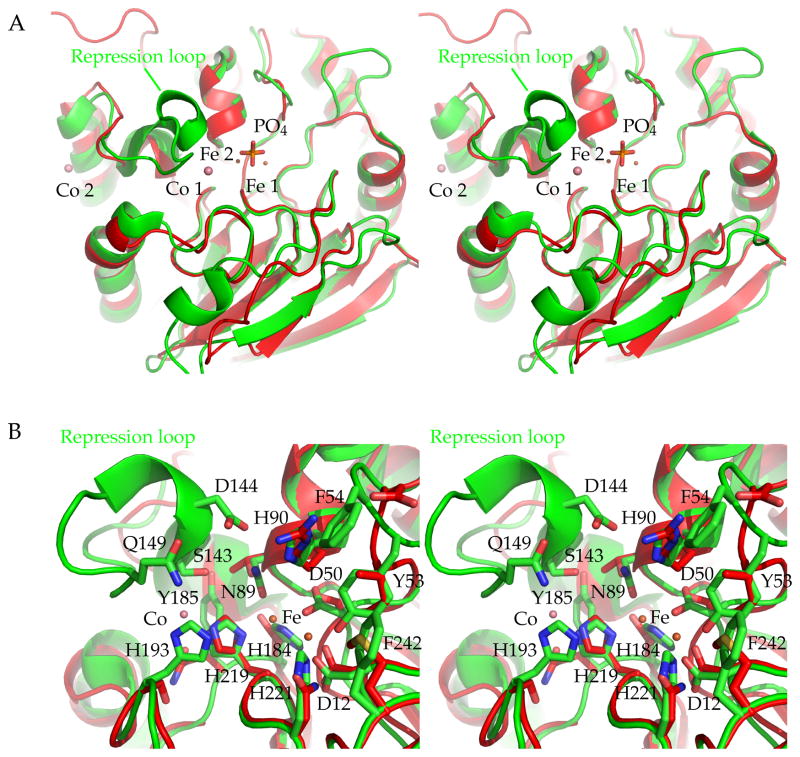
Figure 6. Superposition of hPAP with PfGAP50, active site comparison.
A) Stereo figure overview of the active site region of hPAP active site and PfGAP50, the most prominent feature missing in PfGAP50 is the repression loop. The two cobalt sites of PfGAP50 are indicated with salmon spheres, the iron sites of hPAP are depicted in orange with the bridging phosphate group.
B) Residues involved in coordinating the two iron sites in hPAP. For simplification the phosphate group has been omitted from the figure. Residues and numbering correspond to the hPAP sequence and their side chains are shown in green sticks. The corresponding PfGAP50 residues are shown in red sticks (without numbering).

