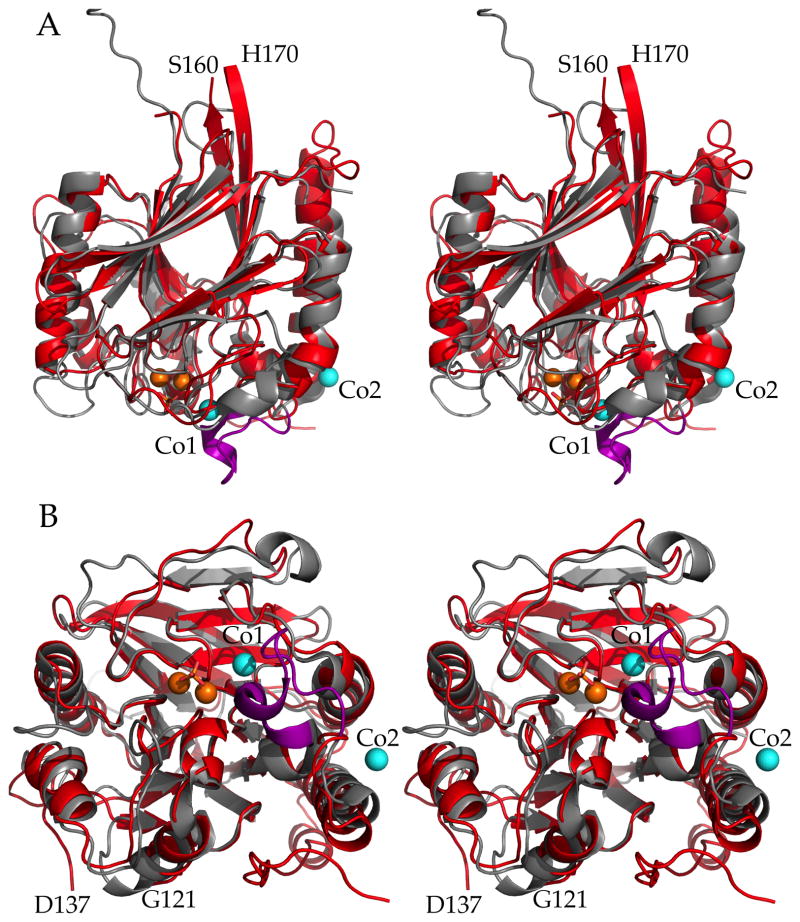
Figure 7. Superposition of PfGAP50 and hPAP.
Stereo figure of PfGAP50 (red) and hPAP (grey) with the latter’s repression loop (purple) superimposed. Cobalt (cyan) and iron (orange) ions are shown as spheres and the bridging phosphate in stick representation.
A) Side view same orientation as Figure 2A.
B) Bottom view (opposite of active site). The loops between Ser160 to His170 and Gly121 to Asp137 are numbered to highlight regions omitted from the PfGAP50 model building due to lack of supportive electron density.

