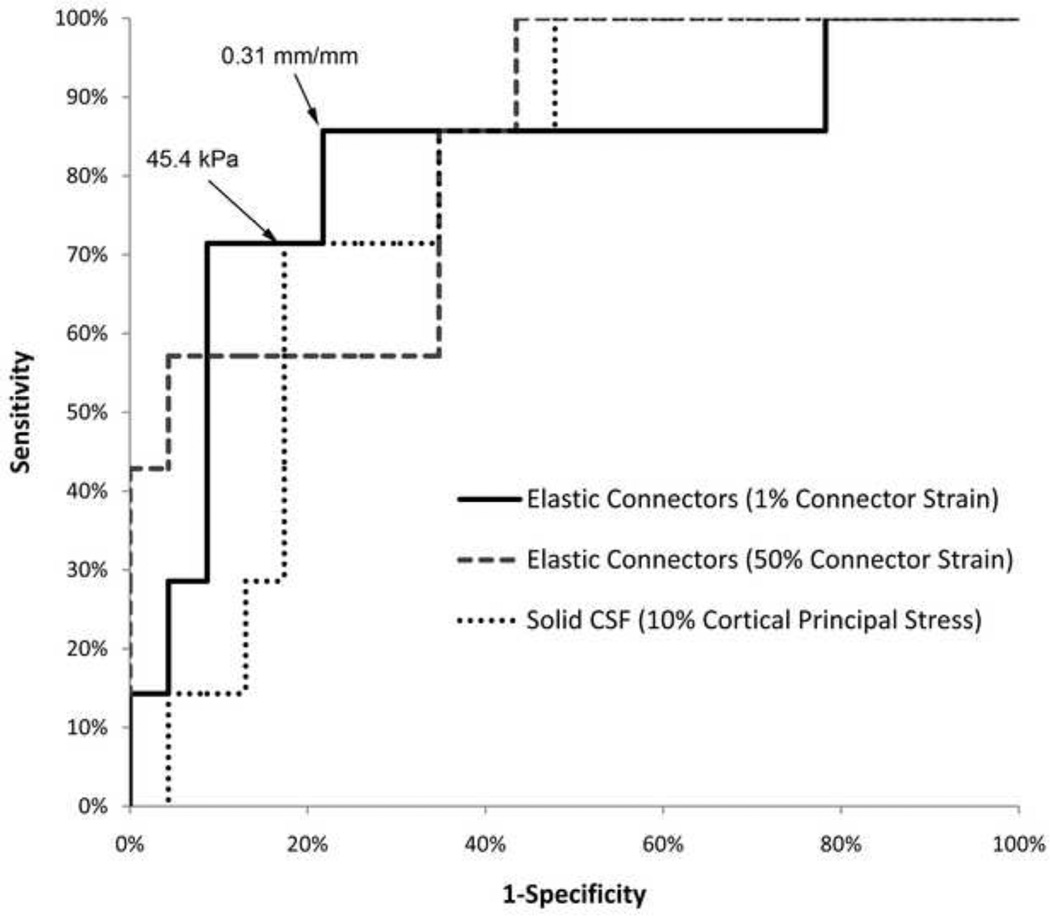
Fig. 8.
ROC curves for the three best biomechanical predictors from both the spring connector and solid element model. Strain experienced by 1% of connector elements in the spring connector model had the overall largest area under the ROC curve and resulted in the best prediction of intracranial hemorrhage using a threshold of 0.31 mm/mm. Cortical principal stress experienced by 10% of the brain elements was the best biomechanical predictor for the solid element model using a threshold of 45.5 kPa.

