
Figure 2. Differentiation and characterization of GABA neurons.
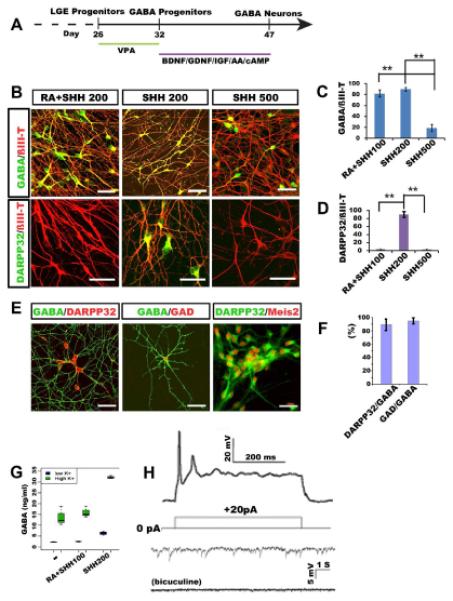
(A) Schematic procedure of GABA neuron differentiation. (B) At day 47, GABA-expressing neurons are present in all cultures but DARPP32-expressing GABA neurons are present only in cultures that were treated with 200 ng/ml SHH but not in higher concentrations of SHH or in both RA and SHH. (C, D) Quantification of GABA and DARPP32 cell populations among ßIII-tubulin+ neurons under the three culture conditions (200 ng/ml SHH, 500 ng/ml SHH, and RA+200 ng/ml SHH). (E) GABA neurons generated under 200 ng/ml of SHH exhibit spiny morphology and express DARPP32, GAD, Meis2. (F) Quantitative analysis of DARPP32 and GAD positive cells among GABA positive cells. (G) HPLC measurement of GABA release from cultures treated with or without high concentration of potassium. (H) Whole cell patch clamping of neurons differentiated for 10 weeks show action potentials and spontaneous inward synaptic currents which are almost completely eliminated by bicuculine. P values (*P<0.05, ** P<0.01) in c, d, f and g were determined using the one-way ANOVA test. Data are shown as means±s.e.m.. Scale bars: 50 m.