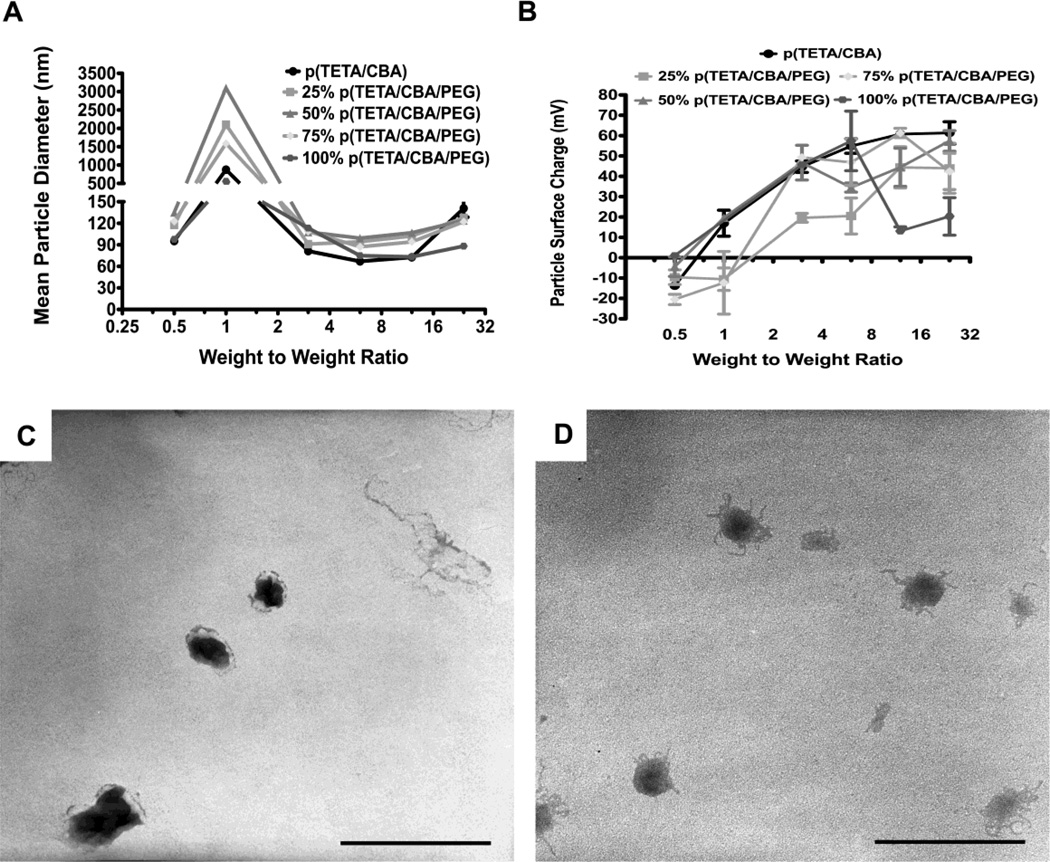
Fig. 2.
Light Scattering and ζ-Potential Measurements were performed to determine polymer/pDNA (polyplex) particle size (diameter) of putative gene carrier formulations (A) and surface charge (B) at increasing polymer concentrations, indicated by polymer/pDNA weight-to-weight ratios on the graphs. TEM images were taken in order to visualize polyplex and 100% 0.5:1 w/w (C) and 100% 3:1 w/w (D) are shown as representative images. Scale bar equals 200nm.

