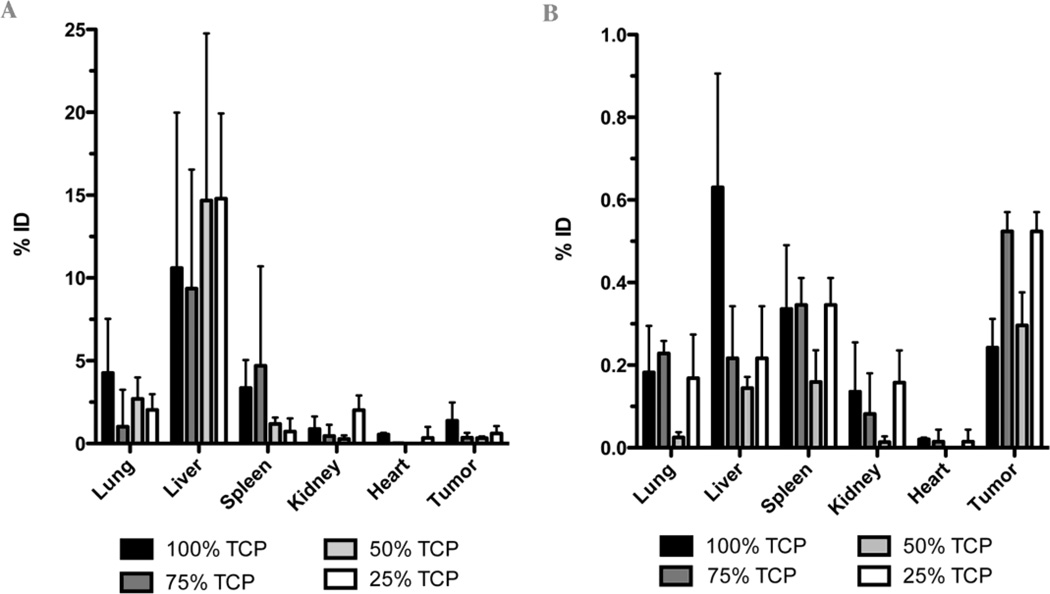
Fig. 6.
Biodistribution of pDNA following systemic injection using 100, 75, 50 and 25% (TCP/TC) formulations as delivery agents in a murine colon adenocarcinoma model. Data are represented as mean ± standard deviation (n = 5) of percent-injected dose (% ID). A) Positively charged complexes formed at 3:1 w/w. B) Negatively charged complexes formed at 0.5:1 w/w.

