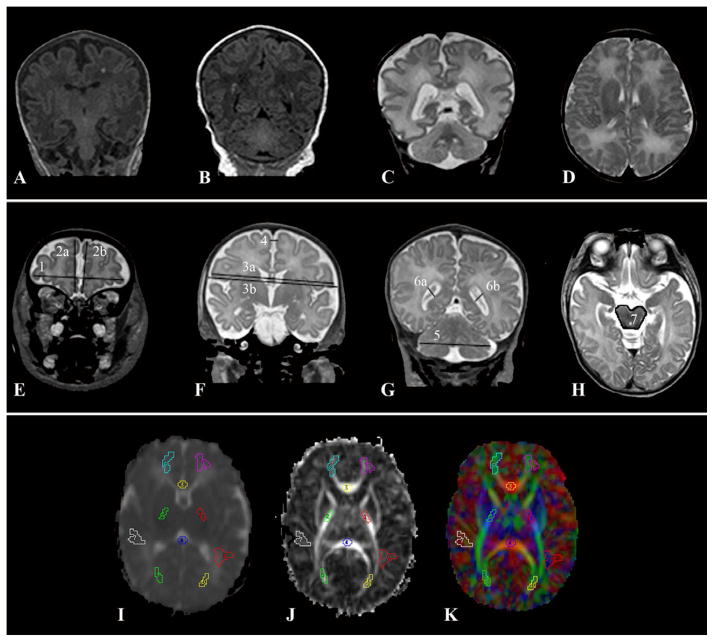
Figure 1.
A–D: Qualitative Scoring Abnormalities A. T1-weighted image with abnormalities that include focal signal abnormality, delayed myelination in PLIC, increased extra-axial space, delayed gyrification. B. T1-weighted image with bilateral focal signal abnormalities, delayed gyrification. C. T2-weighed image with ventriculomegaly, DEHSI, increased extra-axial space, moderate-severe delay in gyrification. D. T2-weighted image with DEHSI. E–H: Subset of Brain metrics. 1) Bifrontal diameter 2a) Right frontal height 2b) Left frontal height 3a) Brain biparietal diameter 3b) Bone Biparietal Diameter 4) Interhemispheric distance 5) Transverse cerebellar diameter 6a) Right ventricular diameter 6b) Left ventricular diameter 7) Brainstem area. I–K: Diffusion Imaging. I. Mean diffusivity J. Fractional Anisotropy K. RGB color plot. Regions of interest are the same for each image (from top to bottom): left and right frontal white matter, genu of the corpus collosum, left and right posterior limb of the internal capsule, splenium of the corpus collosum, left and right subcortical white matter, left and right optic radiations

