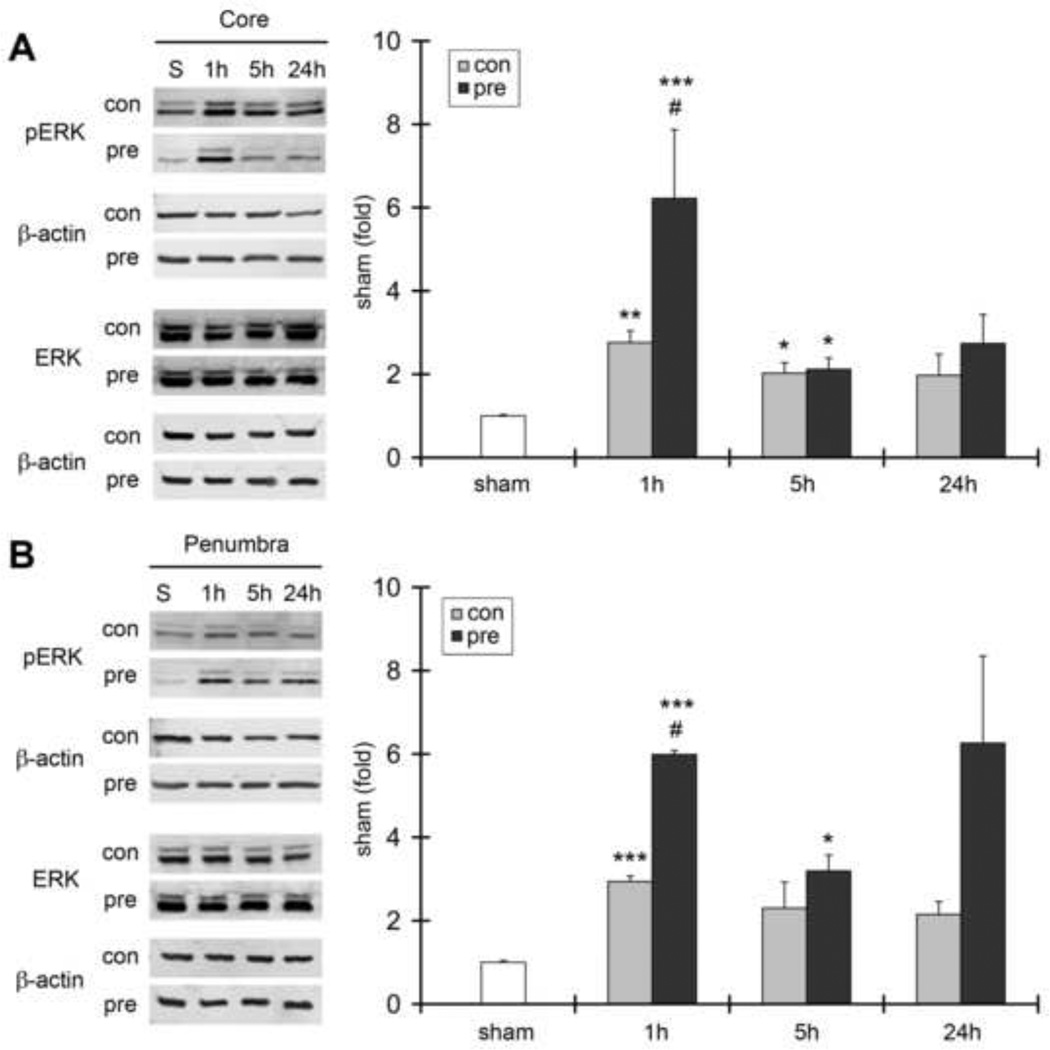
Fig. 3. The effects of stroke and ischemic preconditioning on p-ERK1/2 and ERK1/2 activity.
A. Representative protein bands of p-ERK1/2 and ERK1/2 in the ischemic core 1, 5 and 24 h after stroke. The bar graphs show the mean value of p-Erk1/2 optical densities. No significant changes in ERK1/2 protein bands were detected after stroke, and RIPC did not affect its expression (statistical results are not shown). β-actin was probed to show even protein loading. pERK1/2 was increased after stroke, and RIPC further increased its levels at 1 h after stroke in the ischemic core. B. Representative protein bands of p-Erk1/2 and ERK1/2 in the ischemic penumbra. The bar graphs represented the mean values of protein densities, which were normalized to the values of the sham group. N=3–6/group *, **, *** vs sham, P<0.05. 0.01. 0.001, respectively. # vs control (test) ischemia, P<0.05.

