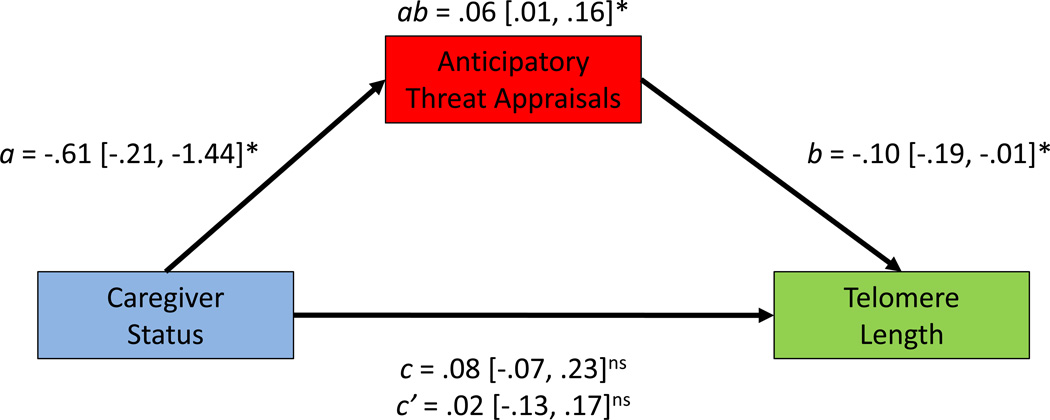
Figure 2.
Illustration of theoretical direct and indirect effects of caregiver status on telomere length. Numbers represent unstandardized coefficients from linear regression with 95% confidence intervals in brackets. Path a represents the significant difference between caregivers and controls in anticipatory threat appraisals. Path b represents the significant relationship between anticipatory threat appraisals and telomere length. Path c represents the non-significant difference between caregivers and controls in telomere length, and path c' represents the non-significant difference between caregivers and controls including anticipatory threat appraisals in the model. Path ab represents the significant indirect effect of caregiver status on telomere length through anticipatory threat appraisals. Asterisks indicate statistical significance of the path coefficients, *p< .05, ns = non-significant.

