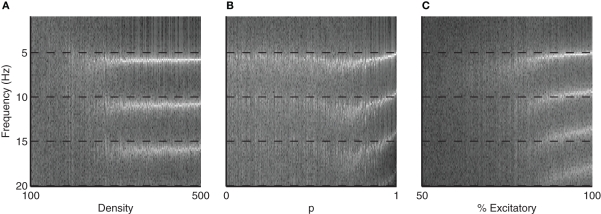
Figure 5.
FFT of GFR signal across different parameters. Images show emergence of synchronous activity as the (A) density, (B) small-world rewiring probability p, and (C) % of excitatory connections are varied. Largest frequency component emerges for all three parameters around just over 5 Hz, corresponding to the frequency of network bursting. The higher values observed in the FFT are harmonics of this 5 Hz bursting. Also note that for increasing density, the emergent frequency of around 5 Hz is more consistent that the other two parameters, where the burst frequency collapses to the final value.

