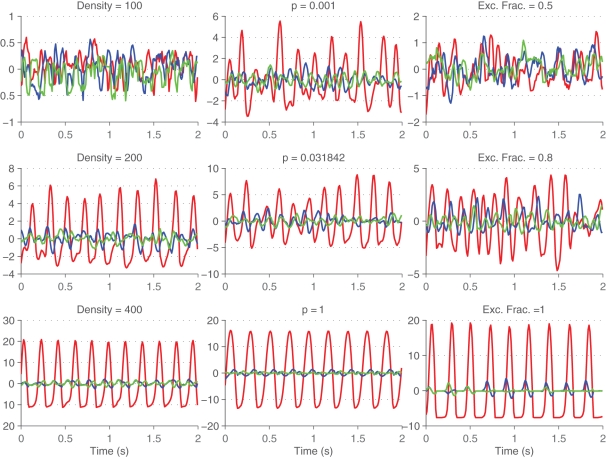
Figure 8.
Neural trajectories across time. First (red), second (blue), and third (green) principal components of the firings rates are shown across time for different values of density (left column), small-world rewiring parameter p (middle column), and fraction of excitatory synapses (right column).

