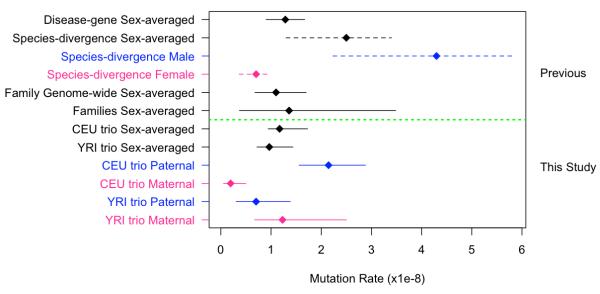
Figure 2. Comparison of mutation rate estimates.
Mutation rates estimated from previous studies are shown above the dashed green line. Solid lines encompassing point estimates represent 95% confidence intervals. Dashed lines encompassing point estimates represent reported plausible ranges. ‘Disease-gene Sex-averaged’ rate comes from 13, with 95% confidence intervals calculated as 1.96 times the standard error. ‘Species-divergence Sex averaged rate’ comes from 14, which specifies the plausible range shown here. Species-divergence sex-specific rates come from scaling the sex-averaged point estimate and upper and lower bounds by the ratio of male/female mutation rate of 6.11 estimated by 3. ‘Family Genome-wide Sex-average’ comes from 7, ‘Families Sex-average’ comes from 4.

