Figure 2.
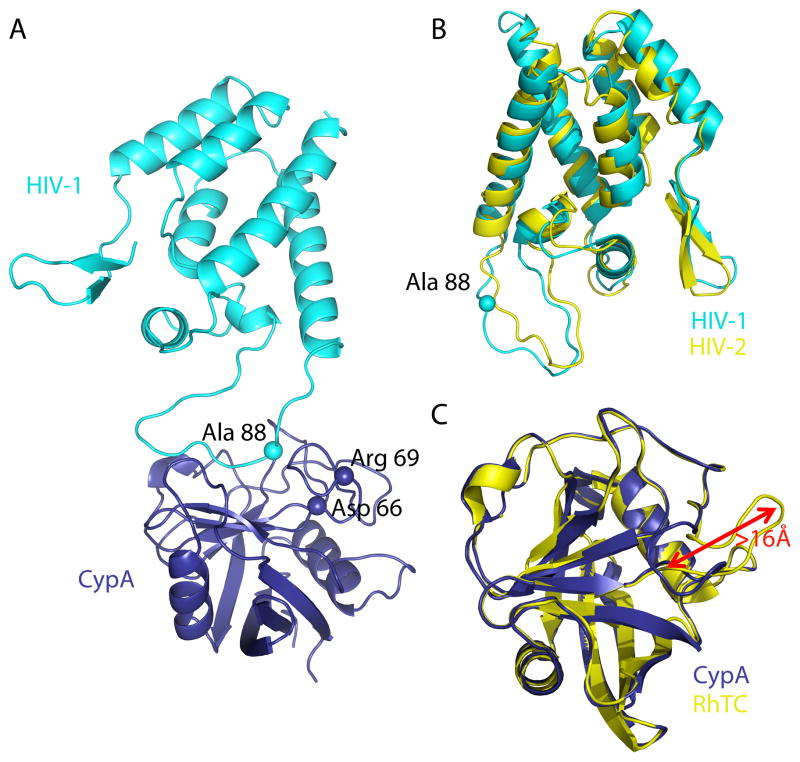
Figure 2A: Cartoon representation of HIV-1-CypA complex (PDB 1AK4, Chains A and D) in which HIV-1 is in cyan and CypA is in dark blue. The proximity of HIV-1 CA residue Ala 88 to the CypA residues Asp 66 and Arg 69 (spheres) is shown.
Figure 2B: Cartoon representation of the N-terminal capsid domains of HIV-1 (PWB 1GWP, first NMR model) in cyan and of HIV-2 (PDB 2WLV, chain A) in yellow after SSM superposition. The cyan sphere indicates the position of Ca Ala 88 in HIV-1, which is deleted in HIV-2.
Figure 2C: Cartoon representation of CypA (PDB 2CPL) in dark blue SSM superimposed on RhTC (PDB 2WLW) in yellow. Loop 64–74, which contains amino acid replacements D66N and R69H has undergone a rearrangement of >16Å.

