
Figure 2.
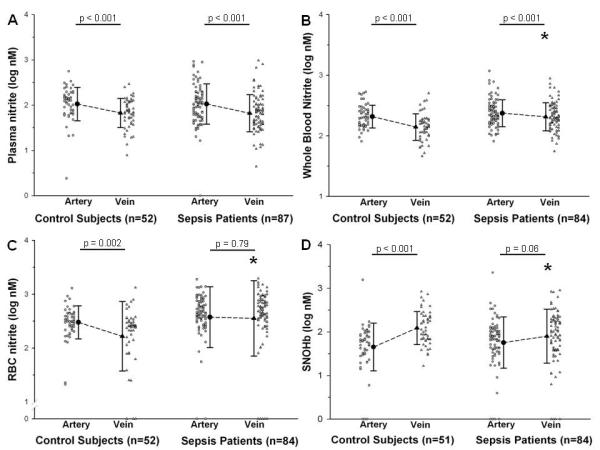
Arterial and venous nitrite and SNOHb concentrations in control subjects vs. sepsis patients. Panel A: plasma nitrite; Panel B: WB nitrite; Panel C: RBC nitrite; Panel D: SNOHb. Concentrations are plotted on the log10 scale. Dot plots show individual data points and corresponding summary plots show mean values with error bars representing standard deviation. Significance values above the bars refer to artery vs. vein comparisons. *p < 0.05 compared to corresponding venous concentration in control subjects.