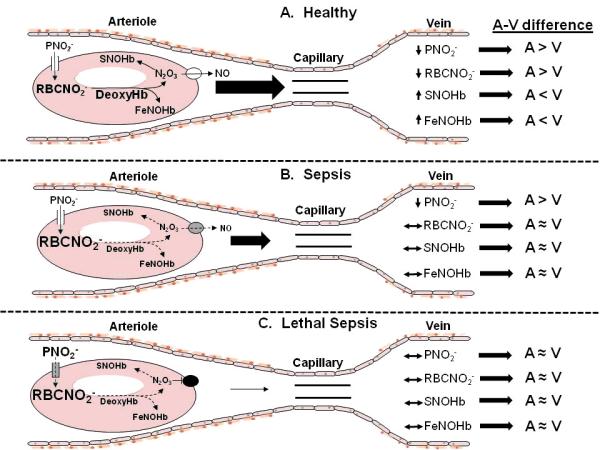
Figure 4.

Proposed model for explaining diminished artery-to-vein NO metabolite concentration differences in sepsis. Panel A. Normal physiology. In resistance arterioles, RBCs become partially deoxygenated and the concentration of deoxyHb increases. DeoxyHb catalyzes the reduction of RBC nitrite (RBCNO2−) to form N2O3 and FeNOHb (22, 25). N203 S-nitrosates Hb forming SNOHb, then exits the RBC through a membrane-associated protein complex where it decomposes to NO (and nitrogen dioxide, not shown), augmenting microvascular blood flow (28). Plasma nitrite (PNO2−) enters the RBC to replenish RBCNO2− (42, 43). This metabolic pathway is reflected by NO metabolite concentrations changes in the draining vein. The net result is A-V differences in NO metabolite concentrations, with higher plasma and RBC nitrite (PNO2− and RBCNO2−) in artery vs. vein, but lower SNOHb and FeNOHb in artery vs. vein (10, 12, 13, 22). Panel B. Sepsis. RBC nitrite metabolism is impaired either because of sepsis-associated derangements of the RBC membrane-associated proteins involved in nitrite reduction and NO export (gray color of membrane protein) or lower concentration of deoxyHb (smaller font) (30, 31). The production of SNOHb and FeNOHb decline (dashed arrows and smaller font), and there is diminished RBC NO release (dashed arrows and smaller font), impairing microvascular blood flow (smaller arrow). The defects in membrane-associated proteins and RBCNO2− metabolism are not yet severe enough to affect PNO2− uptake. The net result is diminished A-V differences in all metabolites except PNO2−. Panel C. Lethal sepsis. The membrane-associated protein and metabolic defects are more severe, eliminating NO export (black color of membrane protein complex) and critically reducing blood flow (smaller arrow). The defects are now severe enough to impair PNO2− uptake by the RBC (gray color of membrane channel, larger PNO2− font). The net result is diminished A-V differences for all NO metabolites shown.
