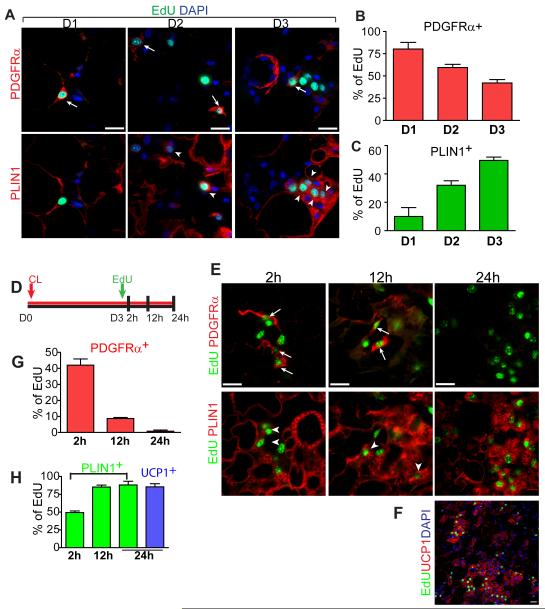
Figure 2. Fate tracing of proliferating cells identifies PDGFRα+ cells as potential iBA progenitors.
(A) Representative images of eWAT paraffin sections triple-stained for PDGFRα, PLIN1 and EdU on D1, D2, or D3 of CL treatment. Note that images of a given day are the same microscopic field. Top row shows merge of PDGFRα (red) and EdU (green), while bottom row is merge of PLIN1 (red) and EdU (green). Arrows mark PDGFRα+ EdU+ cells. Arrow heads mark PLIN1+ EdU+ cells. Nuclei were counterstained with DAPI (Blue). Triply stained images demonstrate that PLIN1 and PDGFRα expression are mutually exclusive. (B, C) Quantification of PDGFRα+ EdU+ cells, or PLIN1+ EdU+ cells in eWAT paraffin sections (mean ± SEM, n = 3-4 per group). Nearly all proliferating cells in eWAT express either PDGFRα or PLIN1. The percentage of PLIN1+, EdU+ cells increased over time (B, p=0.0004) as the percentage of PDGFRα+, Edu+ cells declined (C, p=0.002). (D) Fate tracing of cells labeled with EdU on the third day of CL treatment. 129S1 mice were infused with CL, injected with EdU on D3, and analyzed at indicated time points. (E) Representative images of eWAT paraffin sections triple-stained for PDGFRα, PLIN1 and EdU at 2 h, 12 h, and 24 h after EdU injection. Top row shows merge of PDGFRα (red) and EdU (green), while bottom row is merge of PLIN1 (red) and EdU (green) of the same field. Arrows mark PDGFRα+ EdU+ cells. Arrow heads mark PLIN1+ EdU+ cells. (F) Low magnification fields of eWAT paraffin sections double-stained for EdU (green) and UCP1 (red) at 24h after EdU injection. (G, H) Proportion of each cell type is expressed as percentage of the total EdU+ cells (mean ± SEM, n = 3-4 per group). PDGFRα expression declined (p=0.0002) as PLIN1 expression appeared (p=0.0001) in EdU-labeled cells. By 24 h, 85% of EdU+ cells expressed UCP1. Bars = 20 μm. See also Figure S2.

