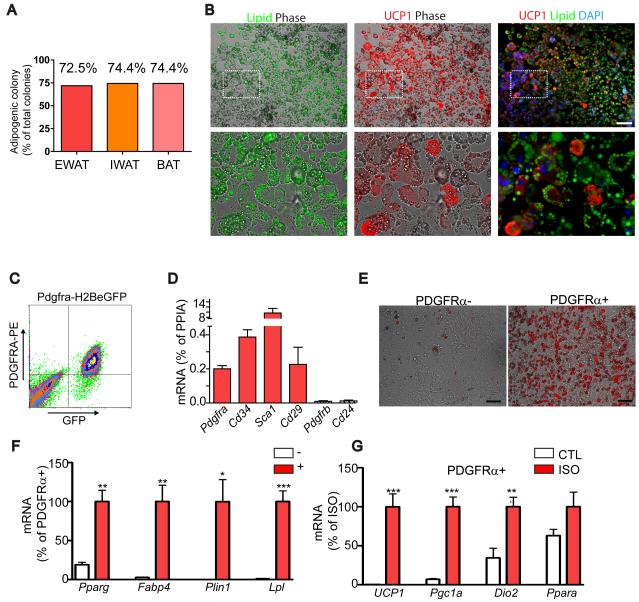
Figure 5. PDGFRα-expressing progenitors are white and brown adipogenic in vitro.
(A-B) Adipogenic potential of clones (n > 39) derived from FACS-isolated PDGFRα+ single cells. (B) Representative images of adipogenic clones double-stained for UCP1 and Lipid (LipidTox). Lipid (left) and UCP1 (middle) fluorescent images were merged with phase contrast, and Lipid and UCP1 images were merged wth DAPI-counterstained images. Bottom row is a magnified view of the boxed regions from top row. All adipogenic clones contained UCP1+ and UCP1- adipocytes, demonstrating WA and BA bipotentiality of PDGFRα+ progenitors. Bar = 100 μm. (C) FACS analysis of H2BeGFP+ (PDGFRα+) cells from WAT. (D) qRT-PCR analysis of surface marker expression after 5-7 days of culture in growth medium (means ± SEM, n=4). (E) Representative images of PDGFRα+ or PDGFRα- cells cultured in the presence of insulin (1μg/mL) for 7 days. Boron-dipyrromethene (BODIPY, red) staining indicates higher insulin-stimulated adipogenesis in PDGFRα+ fractions. (H, I) qRT-PCR analysis on adipocyte gene expression. (F) Expression of adipocyte-specific markers, normalized to that of PDGFRa+ cells. PDGFRα+ cells were significantly more responsive to insulin-induced adipogenesis, compared to PDGFRα- cells (means ± SEM, n=4, Pparg: p=0.002, Fabp4: p=0.004, Plin1: p=0.012, and lipoprotein lipase (Lpl): p=0.0003). (G) Expression of brown adipocyte-specific markers, normalized to levels induced by ISO. Differentiated PDGFRα+ populations (cultured in the presence of Insulin for 7 days) were treated with vehicle (CTL) or isoproterenol (ISO, 10 μM) for 4 h before analysis. (means ± SEM, n=4, Ucp1: p=0.0009, Pgc1: p=0.0003, Dio2: p=0.0095, Ppara: p=0.120). Experiments were repeated 4 times.

