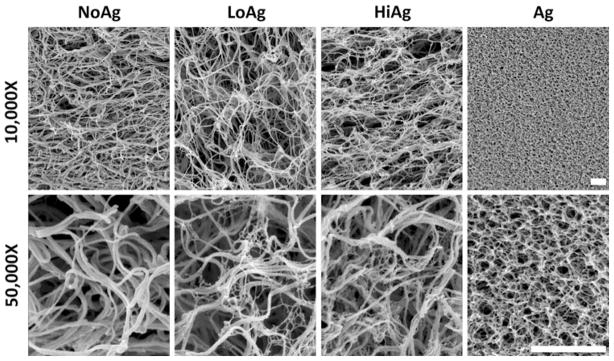
FIGURE 2.
Scanning electron images at 10,000× and 50,000× magnification (top and bottom rows, respectively) illustrate network morphology with increasing agarose concentration from NoAg (0% agarose) to HiAg (0.25% agarose), where fine web-like agarose forms among larger fibers of collagen network; agarose-only gels (far right) exhibit very different structural properties (scale bars = 1 μm).

