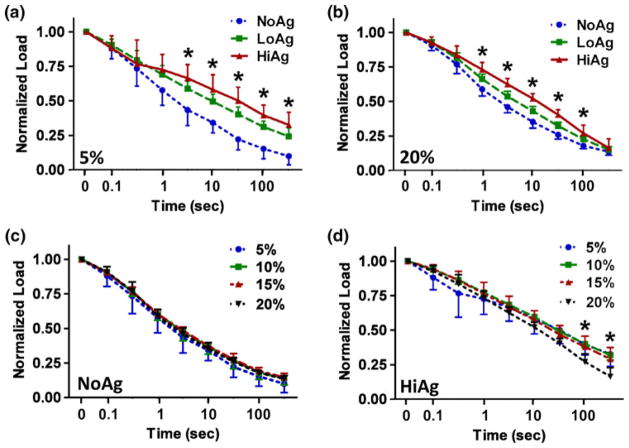
FIGURE 4.
(a, b) Normalized load relaxation curves demonstrate slower relaxation with increasing agarose content, with differences becoming less pronounced at larger displacement (from 5 to 20% displacement); NoAg relaxation (c) is independent of displacement level, while HiAg (d) exhibits slight differences in relaxation behavior at different levels of displacement (mean ± 95% CI; n = 6–8/group; * significant differences).

