Figure 4.
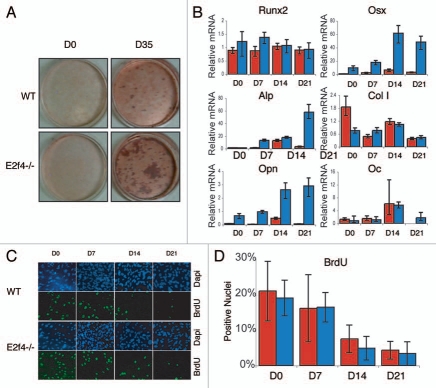
E2f4-/- calvarial cell populations generate more calcified matrix than wildtype calvarial cell populations, but do not display altered proliferation or cell cycle exit phenotypes. (A) ossification of primary calvarial cells was determined by Alizarin Red staining of secreted calcium deposits after 0 and 35 days of induction. E2f4-/- calvarial cells secrete a greater amount of calcium deposits than wildtype osteoblasts (n ≥ 8). (B) Quantitative RT-PCR measurements of bone marker mRNA levels from wildtype (red bars) and E2f4-/- (blue bars) calvarial cells during induction. E2f4-/- calvarial cells express higher levels of Osterix, Osteopontin and, at times, Alkaline Phosphatase mRNAs compared to wildtype cells. Ubiquitin was used as an internal control to normalize for RNA levels within each sample. Each time point is an average of three replicates. Columns, results from a representative littermate pair; error bars represent 1 SD, a representative experiment is shown (n ≥ 3). (C) Indirect immunofluorescence analysis of proliferation in calvarial cells. Wildtype and E2f4-/- calvarial cells were cultured with BrdU for 24 hours at the indicated time points during induction in vitro. DNA within nuclei is stained with DAPI (blue) and incorporated BrdU labeled by indirect immunofluorescence (green). 20X magnification shown. (D) Quantitation of proliferation, a minimum of 250 cells was analyzed per sample from four separate experiments and the percentage of BrdU positive cells calculated in each case and averaged; error bars indicate 1 SD. Wildtype (red bars) and E2f4-/- (blue bars) calvarial cell cultures display similar percentages of BrdU positive cells indicating similar levels of proliferation and cell cycle exit during the induction time course.

