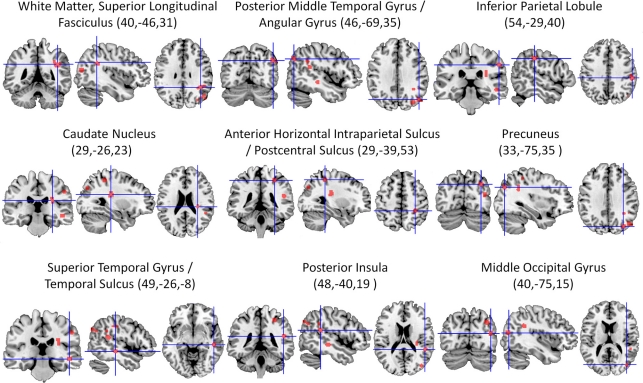
Figure 2.
Overview of all significant clusters (FDR, p < 0.05) derived from the ALE analysis of 20 lesion mapping studies (listed in Table 1), superimposed on a ch2better template using MRIcron. Numbers in parentheses are x, y, and z coordinates of the center of the cluster in MNI space. All lesion clusters are in the right cerebral hemisphere.

